Do licensed scratch-offs like Monopoly and NFL teams pay worse? We reviewed the data
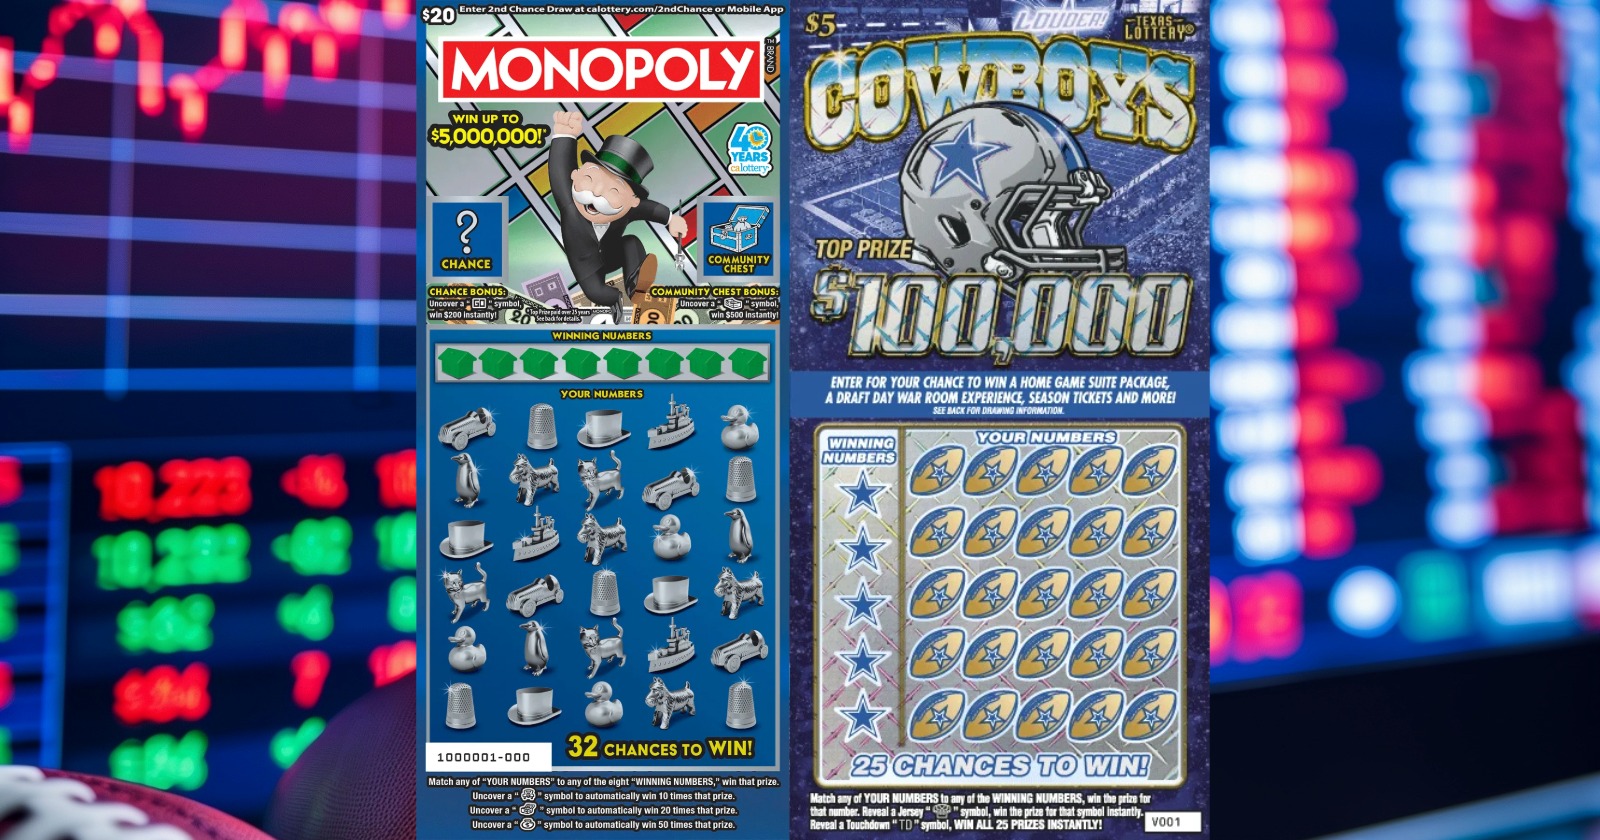
Branded scratch-offs carry a suspicion, because lottery companies have to pay for that branding. Somebody is paying to put Monopoly, Pac-Man, or an NFL team on the front of that ticket, and the intuition is that the money has to come from somewhere. We checked all 65 licensed games currently on sale in the United States to see if these games pay worse.
The raw numbers look damning
Taken as a group, licensed games return an average of 68.6% of sales as prizes, while the rest of the games are at 70.0%. Around 1.4% worse, which looks like an amount you would expect.
The problem with that comparison is the price of the tickets. All 65 licensed tickets we measured average $6.40 per ticket while unlicensed tickets average $9.82 per ticket, and payout climbs steeply with price at every step of the ladder. The group difference is measuring the price mix rather than the licensing. So you need to compare them head to head in the same price tiers.
Price-matched, the gap essentially disappears
| Ticket price | Licensed payout | Unlicensed payout | Difference |
|---|---|---|---|
| $2 | 63.7% | 65.6% | licensed -1.9% |
| $5 | 69.1% | 69.3% | licensed -0.2% |
| $10 | 73.1% | 73.2% | licensed -0.1% |
| $20 | 75.8% | 75.2% | licensed +0.6% |
At $5 and $10, where most licensed tickets live, the difference is around 0.1% to 0.2%, which is basically noise. At $20 the licensed games are actually marginally ahead by 0.6%. Only the $2 tier shows a real gap (lower by 1.9%), and with thirteen licensed games at that price it is a thin sample.
On our own scoring the licensed games actually come out slightly ahead at matched prices: 48.3 against 44.5 at $5, 60.2 against 57.1 at $10, and 69.7 against 66.8 at $20. Licensed games tend to be newer, since a license runs for a fixed term, and newer games have fuller prize tables.
The NFL tickets that started this
The question came up at the ScratchCheck office, because Texas and Louisiana launched three football tickets within two days of each other this month, and all three scored poorly. Cowboys returns 60.2% at $5, Houston Texans returns 64.6% at $5, and Saints All Seasons returns 60.2% at $2. Three licensed games in a row, all below their national price averages.
So the discussion at the office said that this looked like a pattern and these licensed games are worse. Widening the sample to all 65 licensed games showed it was a coincidence of price and of two particular state racks, since Louisiana runs the third-lowest average payout in the country at 61.9% and would produce a weak $2 ticket whatever was printed on it.
The spread within licensed games is enormous
Averages hide the thing that actually matters. Mississippi's $10 Wheel of Fortune rates 87.8 on our ValueScore™ and returns 71.7%. Iowa's $10 The Price Is Right rates 83.7 at 74.2%.
At the other end, Delaware's $1 Monopoly 5X rates 9.3 and returns 57.4%, and Maryland's $1 Monopoly X5 rates 10.0 at 60.6%.
What we would still avoid
Licensed games cluster at cheap price points, and cheap price points genuinely are worse value. If buying the Monopoly ticket means buying a $1 game instead of a $10 one, that choice costs about eleven points of payout, even though the license itself costs nothing. Pick the price first, then the picture.
How we did this. We identified 65 active US scratch-offs whose names match a list of known licensed properties and sports franchises, including NFL club names, Monopoly, Wheel of Fortune, The Price Is Right, Pac-Man, Willy Wonka, Jeopardy, Frogger, Harley-Davidson, Elvis and Airstream, and compared them against the roughly 2,400 other active games with a published payout figure. Current as of August 19, 2026. US games only, Canadian, Irish and UK games are excluded.
Frequently Asked Questions
Do licensed scratch-offs like Monopoly or NFL games pay out less?
No, once you compare like with like. Licensed games average 68.6% payout against 70.0% for unlicensed games, but licensed tickets are cheaper on average, at $6.40 against $9.82. Compare them at the same price and the gap vanishes: at $5 it is 69.1% against 69.3%, and at $10 it is 73.1% against 73.2%.
Does the licensing fee come out of the prize pool?
Our data gives no sign that it does in any measurable way. If a licensing fee were being funded from the prize pool, licensed games would return visibly less at the same price, and across 65 active licensed games they do not.
What is the best licensed scratch-off right now?
Mississippi’s $10 Wheel of Fortune rates 87.8 on our ValueScore™, the highest of any licensed game we score, followed by Iowa’s $10 The Price Is Right at 83.7 and Iowa’s $10 Monopoly Doubler at 81.0.

Phil Nageotte is a writer covering scratch-off odds, expected value, prize data, and more. He joined ScratchCheck in 2026 after years of tracking lottery payouts in spreadsheets of his own.