Why Do Some Scratch-Off Tickets Have Way Better Odds Than Others?
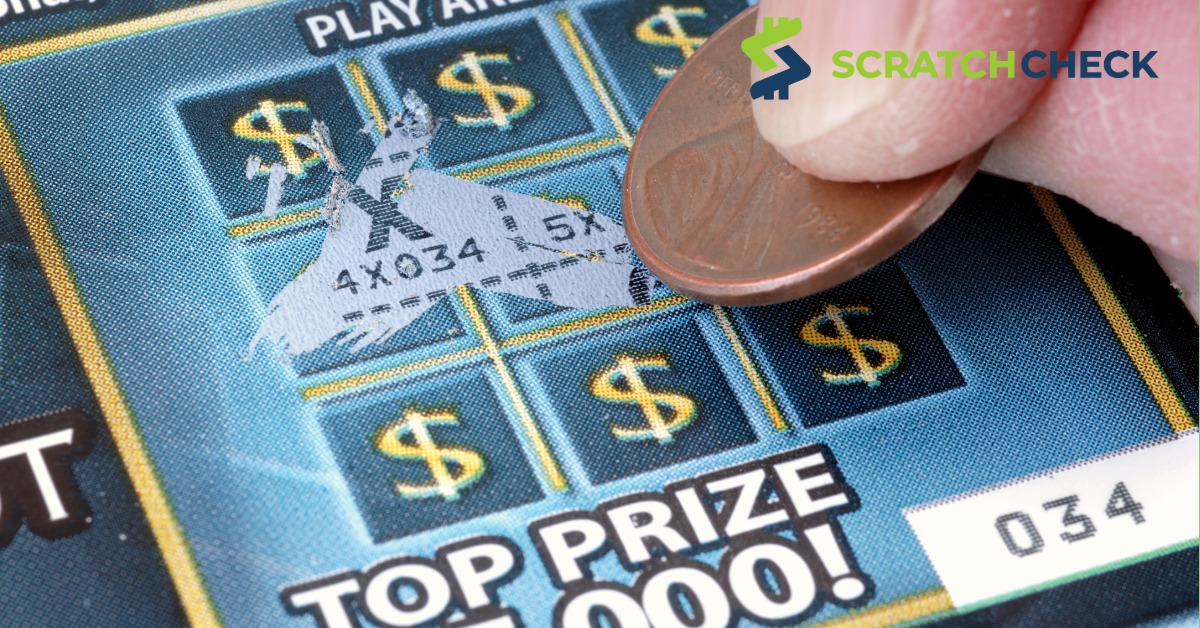
If you flip over two scratch-off tickets at the same price point from the same state, the odds printed on the back can be dramatically different. One $20 ticket might show 1 in 2.90. Another might show 1 in 4.50. Both cost the same. Both were sold at the same register. But one gives you a significantly better statistical experience than the other.
That gap isn't random. There are real reasons why some games are designed with better odds than others, and understanding them helps you make smarter choices about which ticket you pick up.
The State Decides the Prize Structure
Every scratch-off game starts as a design decision by the state lottery. The lottery decides how many tickets to print, what the prize tiers will be, how large the top prize is, and what percentage of total revenue will be returned to players as prizes. These choices directly determine the overall odds.
If a state designs a game with a large top prize and concentrates most of the prize budget there, there's less money available for mid-tier and lower prizes. That usually means worse overall odds because fewer tickets in the print run pay out anything at all. A game designed with smaller, more frequent prizes spread across many tiers tends to have better overall odds even if the top prize is more modest.
States make these design choices based on what they think will sell. Some markets want the big jackpot dream. Others respond better to frequent small wins. The odds you see on the back of the ticket are a direct output of those design decisions.
Price Point Is the Biggest Driver
The clearest pattern in scratch-off data is that odds improve as price goes up. This holds across almost every state lottery consistently.
A $1 or $2 ticket typically has overall odds around 1 in 4.50 to 1 in 5.50. A $5 ticket might run 1 in 4.00 to 1 in 4.50. A $20 ticket from the same state can come in at 1 in 3.00 or better. The best $30 and $50 games nationally regularly hit 1 in 2.30 to 1 in 2.70.
The reason is straightforward. A higher ticket price gives the lottery more revenue per ticket to work with. More revenue per ticket means more prize money available per ticket, which allows a denser distribution of prizes throughout the print run. On a $1 ticket, the lottery is working with $1 of revenue. On a $30 ticket, it's working with $30. Even with a higher payout rate on the expensive ticket, the absolute dollar value of prizes per ticket is much higher, which translates to better odds.
This is why the top of the national best overall odds rankings is almost entirely $20, $25, $30, and $50 games. Budget tickets with exceptional odds are rare outliers, not the norm.
How Much the State Keeps
Every dollar you spend on a scratch-off gets split between prizes, state profit, retailer commissions, and administrative costs. The prize share is what directly determines odds. States that allocate a higher percentage of revenue to prizes will have better overall odds than states that keep more.
This varies meaningfully by state. Some states consistently design games with 75 to 82 cent payout rates. Others run games at 60 to 65 cents per dollar. Players in high-payout states like Massachusetts and Arizona get more back per dollar than players in lower-payout states, all else being equal.
It also varies by price tier within the same state. The impulse-buy tier at $1 and $2 is where state margins are typically highest. Premium tickets give up more margin to attract players willing to spend more per play. That's why payout rates rise with price across virtually every state lottery.
The Top Prize Size Trade-Off
A game with a $10 million top prize has a problem that a game with a $500,000 top prize doesn't: it has to set aside a massive amount of the prize budget for that one jackpot. That money has to come from somewhere, and it typically comes from reducing the number of smaller prizes in the print run, which makes overall odds worse.
Two games at the same price point can have wildly different overall odds if one has a $10 million jackpot and the other caps at $500,000. The smaller-jackpot game can afford to put more winning tickets throughout the print run. The bigger-jackpot game has less budget left for frequent small wins.
This is why overall odds alone don't tell the full story about which game is worth playing. A game with slightly worse odds but a dramatically larger top prize might still be the right choice depending on what you're hoping to win. ValueScore accounts for both factors at once, balancing win frequency, prize quality, expected value, and remaining inventory into a single rating.
Why Games From Different States Have Different Odds
Some states consistently produce games with better odds than others. Iowa, Georgia, Maryland, and Oklahoma regularly place multiple games near the top of the national rankings. Other large states with massive player bases rarely crack the top tier.
Part of this is state policy: how much the lottery has decided to give back versus keep. Part of it is game design philosophy. Some state lotteries prioritize frequent wins and player satisfaction. Others prioritize maximizing revenue for public programs, which means keeping more per ticket.
If you live near a state border, knowing which neighboring state runs better games is worth looking into. Driving ten minutes for a $20 ticket with 1 in 2.90 odds instead of 1 in 4.50 odds is a meaningful difference if you play regularly. The state-by-state rankings on ScratchCheck let you compare what's active anywhere in the country with live data.
Odds Shift as Prizes Are Claimed
The printed odds on a scratch-off ticket never change. They're calculated at the time of printing based on the full print run and never updated. But the effective odds of winning the top prize shift constantly as prizes are claimed.
A game with 10 top prizes in a print run of 2 million tickets has initial jackpot odds of 1 in 200,000. Once 8 of those jackpots are claimed and the game is still selling, your odds of hitting one of the 2 remaining prizes across however many tickets are still in circulation are very different from the printed number, in either direction depending on how many tickets remain.
This is why checking remaining top prizes before you buy matters independently of the printed odds. A game with excellent printed odds and zero top prizes left has worse effective jackpot odds than a game with mediocre printed odds and a full prize pool. The best odds rankings on ScratchCheck filter out games with no top prizes remaining so you're only looking at games where the jackpot is actually still available.
The Bottom Line
The gap between the best and worst odds on tickets at the same price comes down to three things: how much of the revenue the state allocated to prizes, how the prize budget was distributed across tiers, and how large the top prize is relative to the rest of the prize pool.
None of this is hidden information. States are required to publish odds for every game. The data is out there; it's just scattered across 48 different lottery websites in inconsistent formats. That's the problem ScratchCheck solves. Pulling it all into one place, updated daily, so you can see which games actually have good odds before you're standing at the register.
Browse scratch-off odds by state and price point at ScratchCheck.com

Phil Nageotte is a writer covering scratch-off odds, expected value, prize data, and more. He joined ScratchCheck in 2026 after years of tracking lottery payouts in spreadsheets of his own.