
Compare Kentucky Scratch-Offs
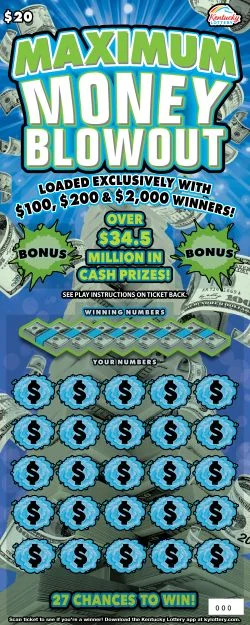
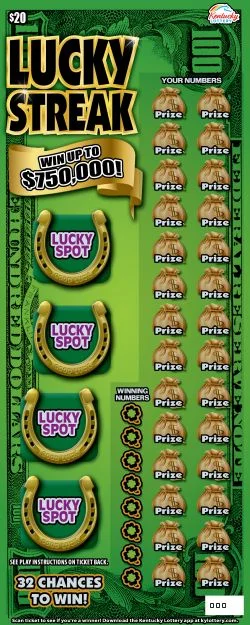
Maximum Money Blowout vs Lucky Streak
Put any two active Kentucky scratch-offs side by side. We score each on ValueScore, expected value, payout rate, overall odds, big-win odds, break-even chance, and top-prize health, then call a winner so you can tell which ticket your dollar goes further on.
Three steps to a smarter pick.
- STEP 1Pick Game AChoose any active Kentucky scratch-off from the first dropdown. Filter by price if you want to compare tickets at the same tier.
- STEP 2Pick Game BChoose a second game from the other dropdown. Both games appear as ticket thumbnails once selected.
- STEP 3Read the verdictWe compare eight metrics including ValueScore, expected value, payout rate, overall odds, big-win odds, and break-even chance. The OUR PICK banner names the winner and explains why.
Common questions.
ValueScore is a composite index from 0 to 100 that blends expected value, prize quality, win frequency, and inventory health. Higher is better. It lets you rank games across price tiers without manually weighing four separate metrics.
Overall odds of 1 in X describe how many tickets you would need to buy on average to hit any prize. Lower X means more frequent wins, though most wins at that frequency are small. Pair overall odds with expected value to see if those wins are actually worthwhile.
Expected value is the average return per dollar played. We sum the value of every remaining prize tier, weighted by its probability, then divide by the ticket price. A $1 ticket returning $0.70 on average has an EV of $0.70.
The OUR PICK verdict tallies eight metrics: ValueScore, expected value, payout rate, overall odds, odds of winning $1,000 or more, break-even chance on $100, top prize, and top prizes still unclaimed. It flags the game that wins the most, and metrics where the games are even count for neither side. When the win totals tie, the higher ValueScore breaks it, since ValueScore is the composite that already blends those factors and is how the rest of the site ranks games. On a dead heat across everything we show a toss-up instead of forcing a pick.
Scratch off data refreshes daily from the Kentucky lottery. Remaining top prizes can shift during the day as prizes are claimed, but price, overall odds, and payout rate only change when the lottery updates its public pack data.