We tested the most common lottery superstitions against 2,315 drawings

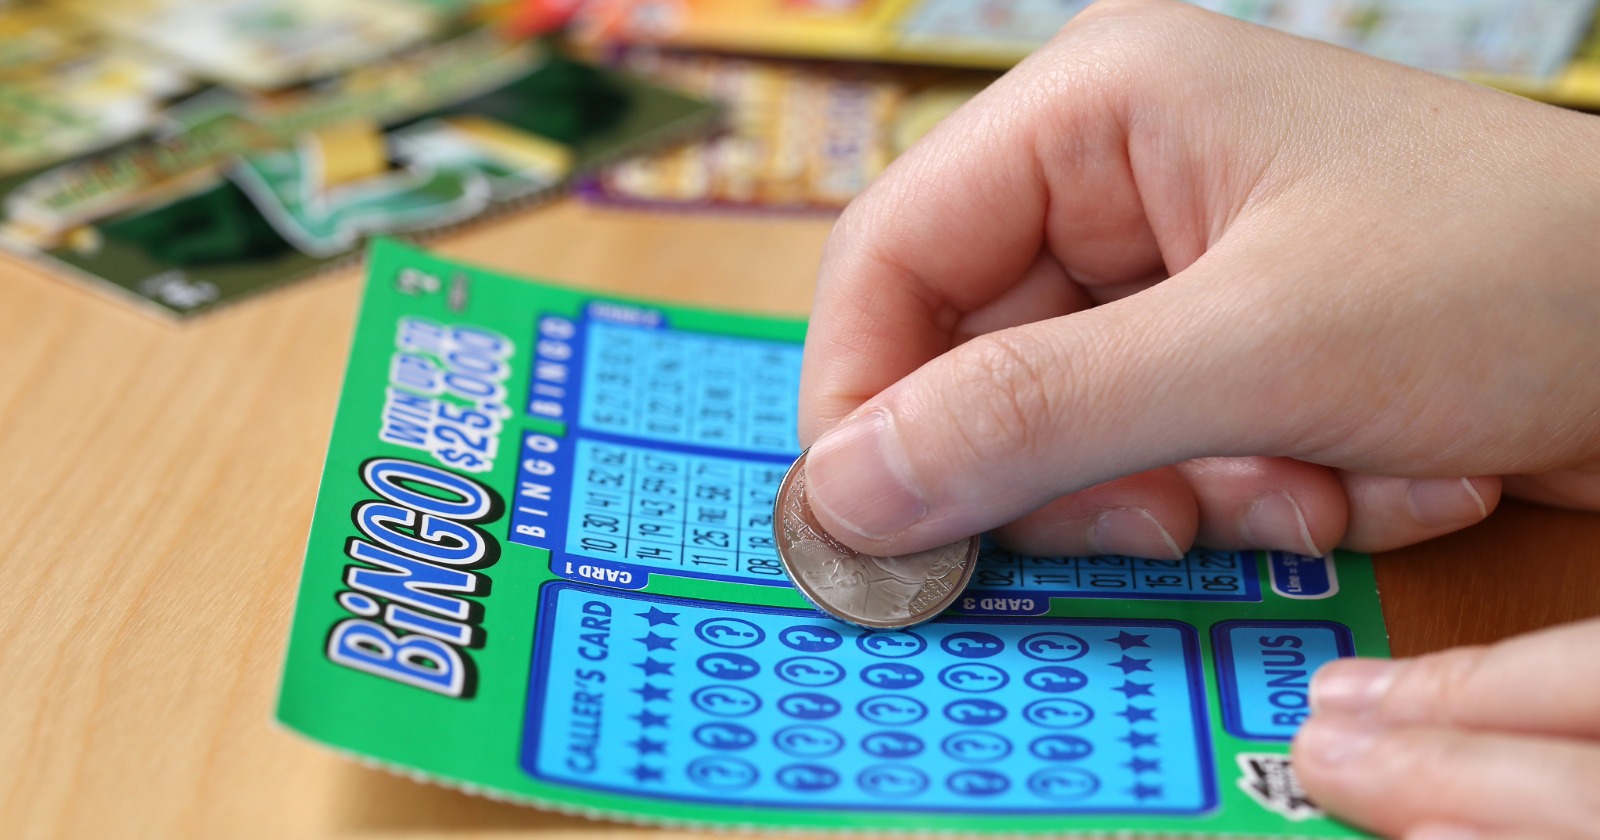
Many lottery players are ritual people. Lucky socks, the same clerk at the same store, playing the same numbers since 1994, a particular way of scratching the ticket with a special coin. We pulled every Powerball and Mega Millions drawing under the current ball formats, 2,315 of them, and tested the beliefs that can actually be tested.
The numbers don't care
The most-drawn Powerball number since the game moved to a 1 to 69 pool is 61, which has come up 125 times in 1,396 drawings. The least-drawn is 13, at 75. Put those two side by side and it looks like the game has favorites, but it doesn't.
With 69 numbers over 1,396 draws, each should appear about 101 times, and random variation alone produces a spread of roughly 10 around that figure. The spread we actually measure is 10.82. In Mega Millions the observed spread is 7.54 where chance would give 8.10, so that game's numbers are slightly more even than randomness requires. Both results say the same thing though: what looks like hot and cold is the ordinary lumpiness of coin flips.
Lucky 7 and unlucky 13
The data here is kind of funny.
| Number | Powerball appearances | Mega Millions appearances |
|---|---|---|
| Expected by chance | 101.2 | 65.6 |
| Lucky 7 | 95 | 61 |
| Unlucky 13 | 75 | 65 |
In Powerball, 13 really is the least-drawn number in the game, exactly as superstition would predict, and 7 comes up less often than average despite its lucky reputation. A believer could stop reading there and feel vindicated.
Then look at the same two numbers in Mega Millions, where 13 has appeared 65 times against an expected 65.6, which is basically dead average, and 7 is again slightly below at 61 appearances. The unluckiest number in one game is the most ordinary number in the other, drawn from the same physical process in the same years, and that's all coincidence.
Birthday numbers: the superstition that may cost money
Most people who pick their own numbers use important dates, which confines them to 1 through 31. The question is whether that hurts, and the answer has two halves that point in opposite directions.
All five Powerball numbers landed inside the birthday range (1 - 31) in just 21 of 1,396 draws, which is 1.50%, and the exact probability is 1.51%. The average draw contained 2.214 numbers in that range against a predicted 2.246. The balls have no opinion about calendars.
What it changes is how many people you share with. Low numbers are massively over-picked, so a jackpot that lands on five birthday-range numbers has more tickets matching it. In our own draw records, Powerball jackpots split between two or more winners averaged 2.833 numbers in the 1 to 31 range against 2.586 for jackpots won outright, which points the way the theory predicts. We would not lean on that too hard, because only six split jackpots have occurred under the current format, and Mega Millions has two, running the other way. The mechanism is sound and our sample is small.
The lucky socks
Nothing about clothing, routes to the store, or which hand you use to hand over the money touches the outcome. A drawing is decided by machines you are not in the room for, and a scratch-off ticket's result was fixed at the printer months before you bought it.
Psychologists have a name for why the rituals persist. In a 1975 study published in the Journal of Personality and Social Psychology, Ellen Langer sold office workers lottery tickets, letting some choose their own and handing others a ticket at random. When she later offered to buy the tickets back, the people who had chosen theirs wanted roughly four times as much money, about $8 against about $2. Choosing had changed nothing about the odds and everything about how much the ticket felt worth. Langer called it the illusion of control, an expectation of personal success higher than the actual probability warrants.
That is the honest verdict on lucky socks. They are free, they are part of why the game is enjoyable, and there is no reason to give them up. They only turn expensive when the ritual starts making decisions for you.
Where rituals start costing money
Scratch-off superstitions do more damage than draw-game ones, because a scratch player is choosing between games that genuinely differ. A lucky store that happens to stock a weak rack of tickets, a game that feels due, or a refusal to buy the first ticket off a roll all push players toward worse tickets. We went through those one by one in the scratch-off superstitions that cost players real money.
The most expensive belief we can measure is the idea that a game is owed a win. Right now 345 active scratch-offs across the country still sit on retailer racks with zero top prizes left to award, roughly one in eight of every game on sale. A player buying one of those because it has not paid out lately is chasing a prize that is already gone, and no amount of ritual brings it back. Remaining prize counts are published by every state and sit on each of our game pages, alongside the ValueScore™ rankings.
The second costly habit is the ritual of not checking. Tickets tucked in a visor or a drawer to be dealt with later are how prizes expire, and the deadlines are shorter than most people assume. Ours are listed in how long you have to claim a scratch-off prize.
Keep the socks. Check the ticket.
How we did this. We analyzed every Powerball drawing from October 7, 2015, when the current 1 to 69 white-ball format began, and every Mega Millions drawing from October 31, 2017, when its 1 to 70 format began, through August 19, 2026. That is 1,396 and 919 drawings. Restricting to a single ball format matters: pooling all 3,844 Powerball draws since 1992 makes low numbers look heavily favored, purely because the ball pool has grown six times and early draws could not produce a number above 45. Expected frequencies and the 1.51% birthday figure are computed directly from the current matrices. Scratch-off figures come from our own database of active US games.
Sources
Ellen J. Langer, The Illusion of Control, Journal of Personality and Social Psychology, 1975
Frequently Asked Questions
Are some lottery numbers luckier than others?
No. Across 1,396 Powerball drawings under the current 1 to 69 format, the most-drawn number came up 125 times and the least-drawn 75 times. That looks like a big gap, but the spread across all 69 numbers is 10.82 against the 10.06 pure chance would produce. The variation is noise, not a pattern.
Do birthday numbers reduce your chances of winning?
Not your chance of winning, only the size of what you keep. All five Powerball numbers landed in the 1 to 31 birthday range in 1.50% of draws, and pure chance predicts 1.51%. The problem is that millions of other players pick birthdays too, so a jackpot hit on low numbers is more likely to be split several ways.
Does wearing lucky clothes or following a ritual change anything?
It changes nothing about the outcome. A scratch-off or a drawing has a fixed prize structure decided before you walk into the store. Rituals cost nothing as long as they stay rituals. They start costing money when they decide which ticket you buy or stop you checking one you already have.

Phil Nageotte is a writer covering scratch-off odds, expected value, prize data, and more. He joined ScratchCheck in 2026 after years of tracking lottery payouts in spreadsheets of his own.