
Washington DC · Highest Prize Payout
Last updated October 19, 2026
VIP Club ($30) leads Washington DC with a 78.5% prize payout rate. Payout percentage measures how much of each dollar spent is returned as prizes across all winners.
| Rank | Game | Price | Payout % | Top Prize |
|---|---|---|---|---|
| 1 | 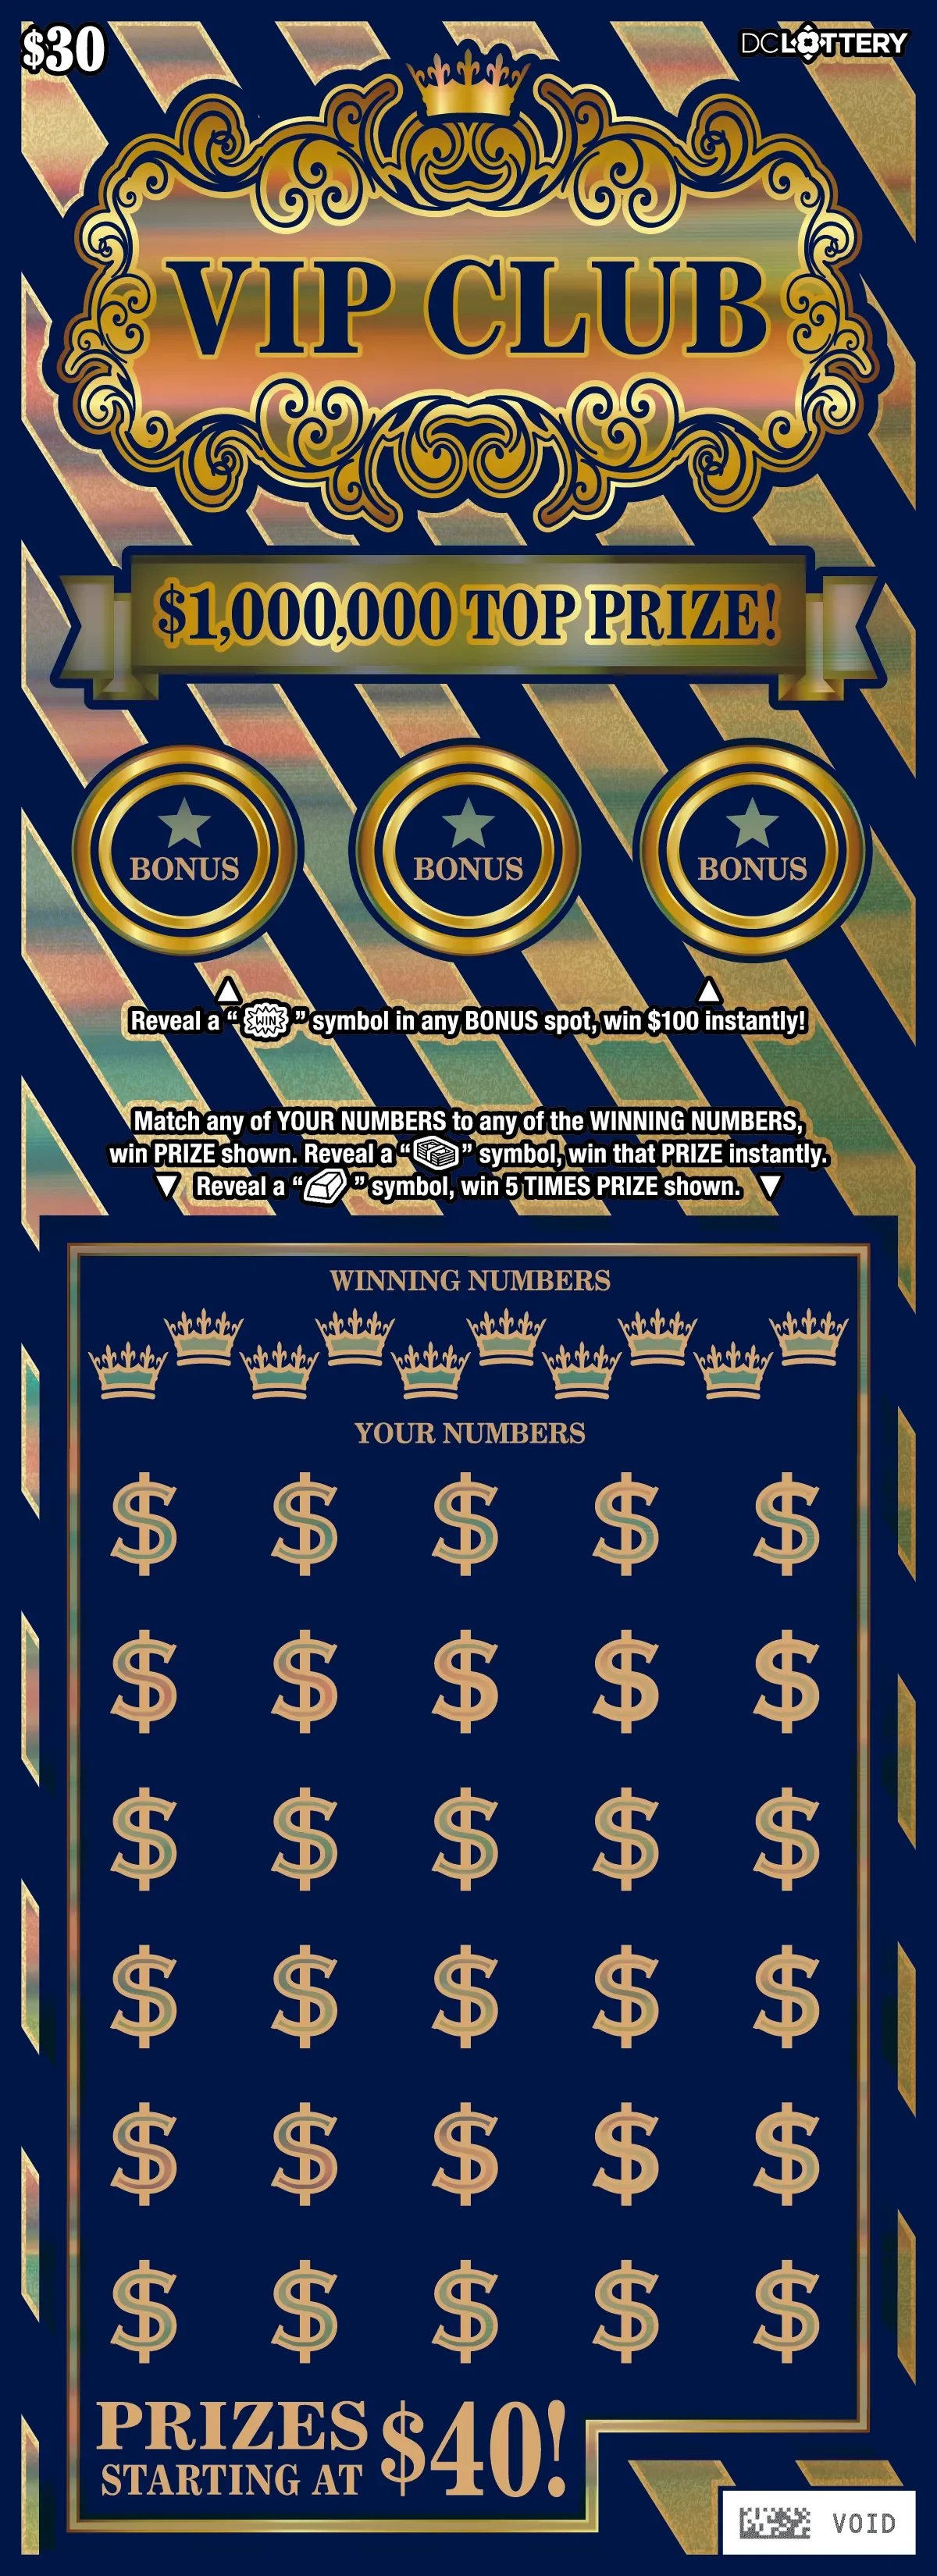 VIP Club VIP Club | $30 | 78.5% | $1,000,000 |
| 2 | 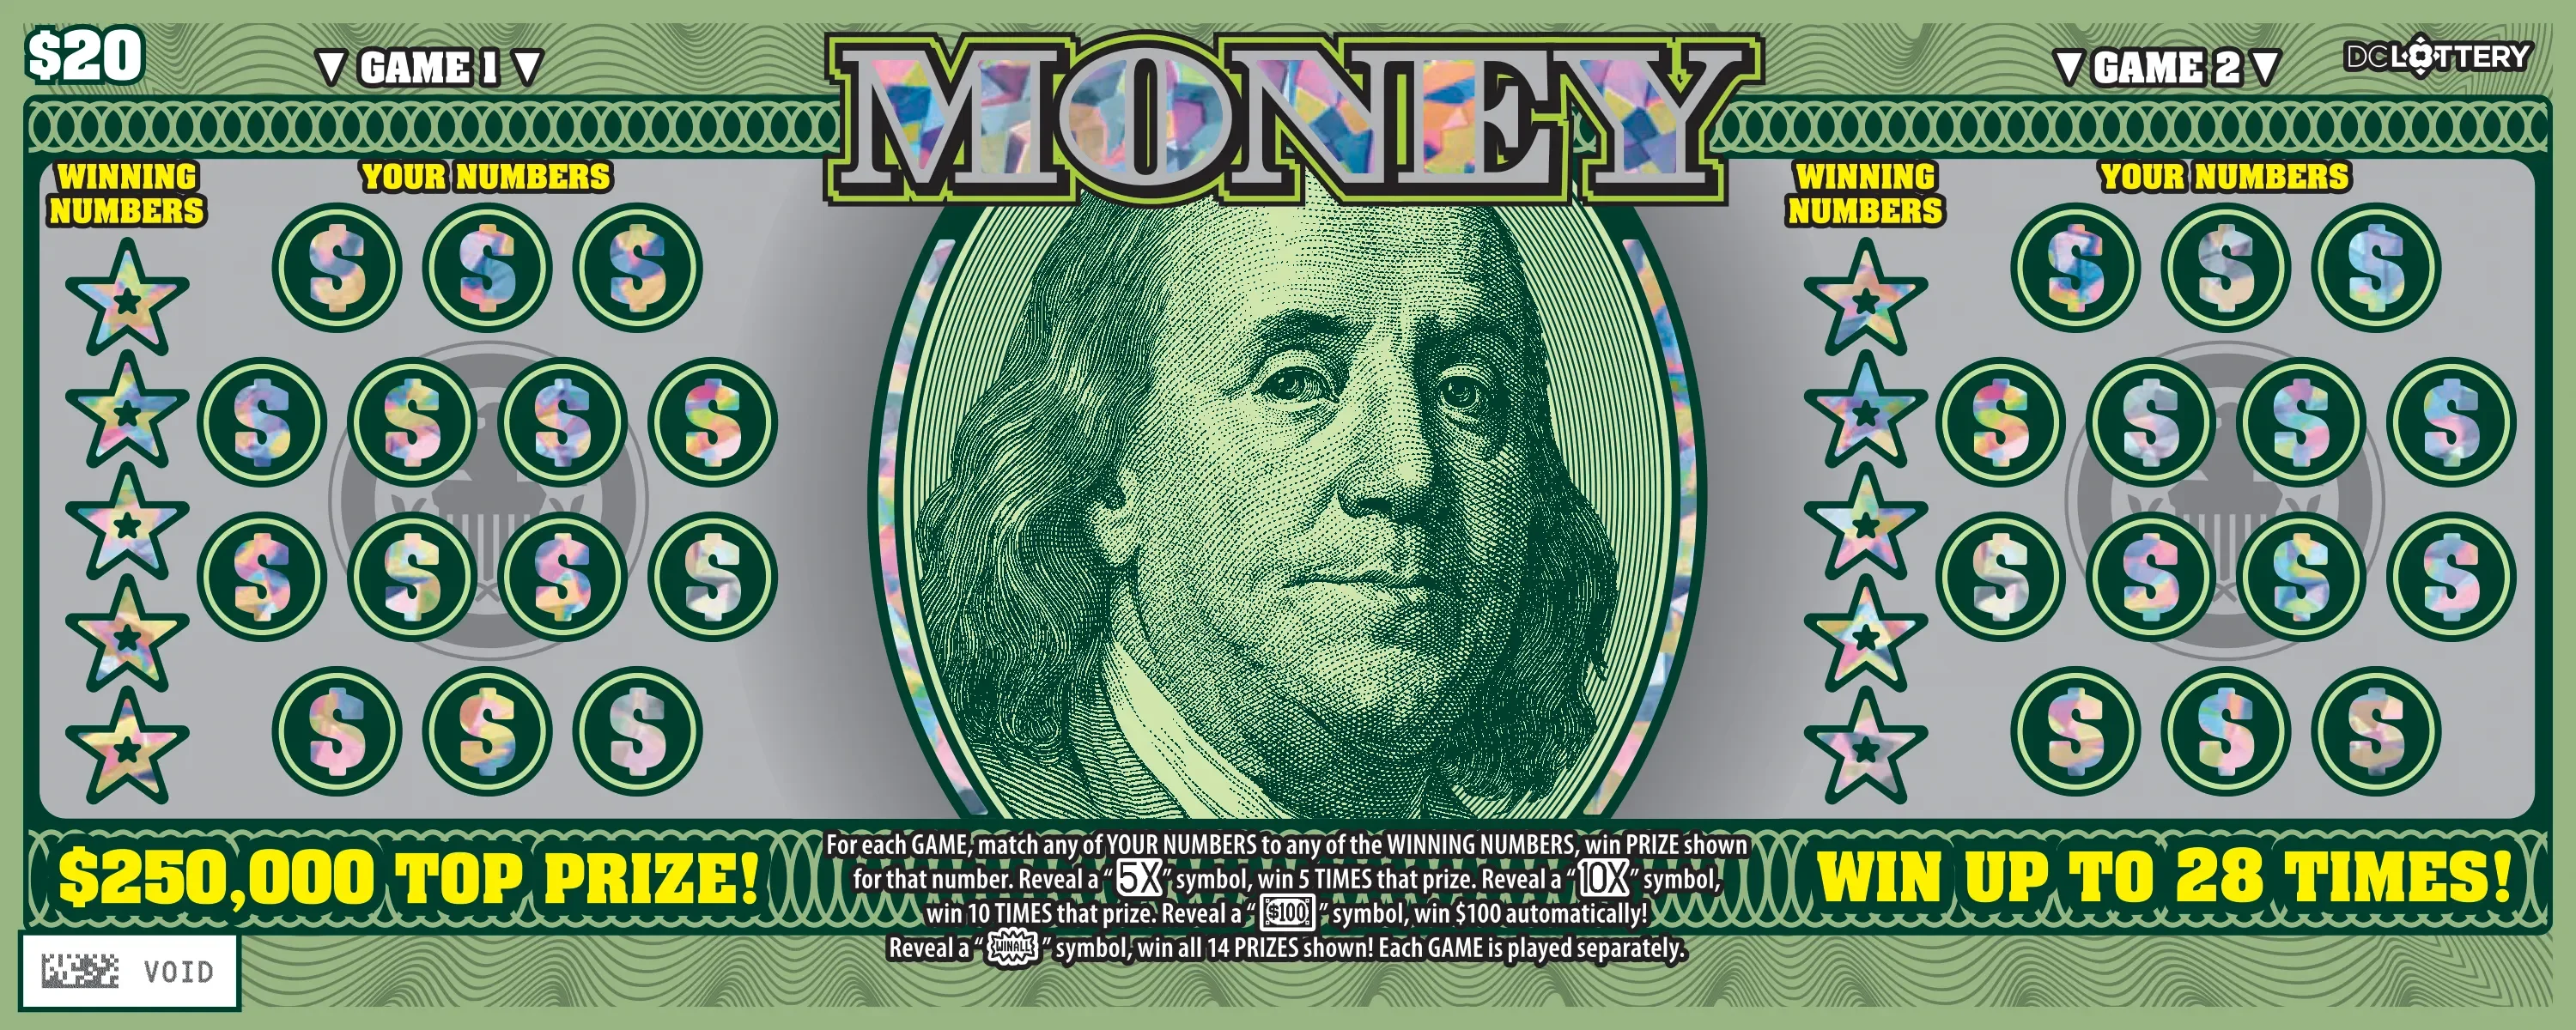 Money Money | $20 | 77.8% | $250,000 |
| 3 | 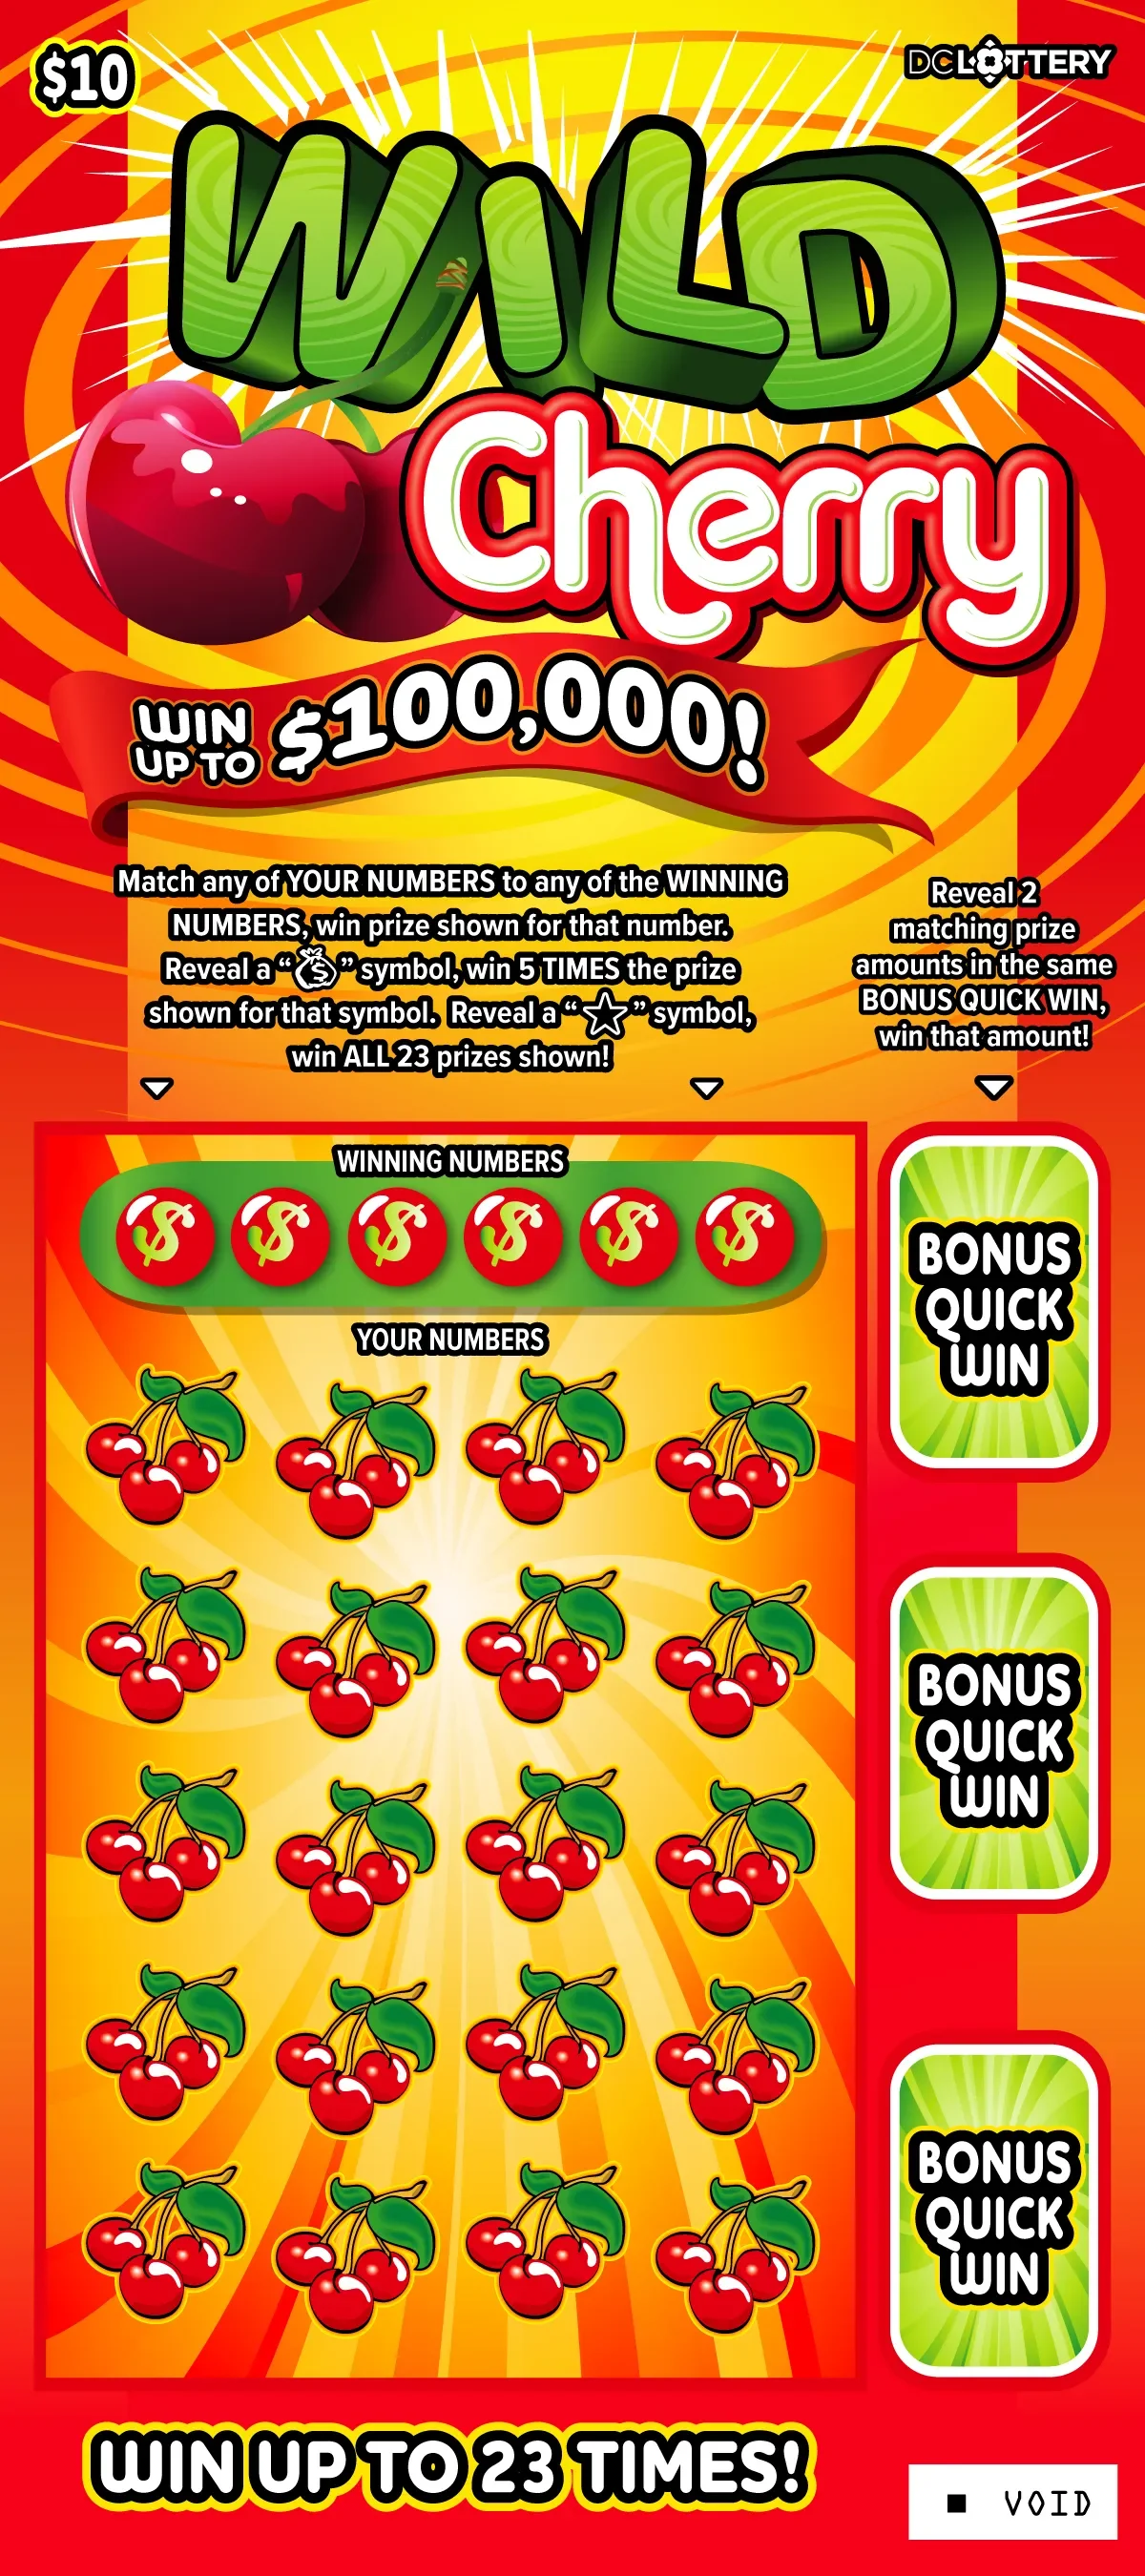 Wild Cherry Wild Cherry | $10 | 74.6% | $100,000 |
| 4 | 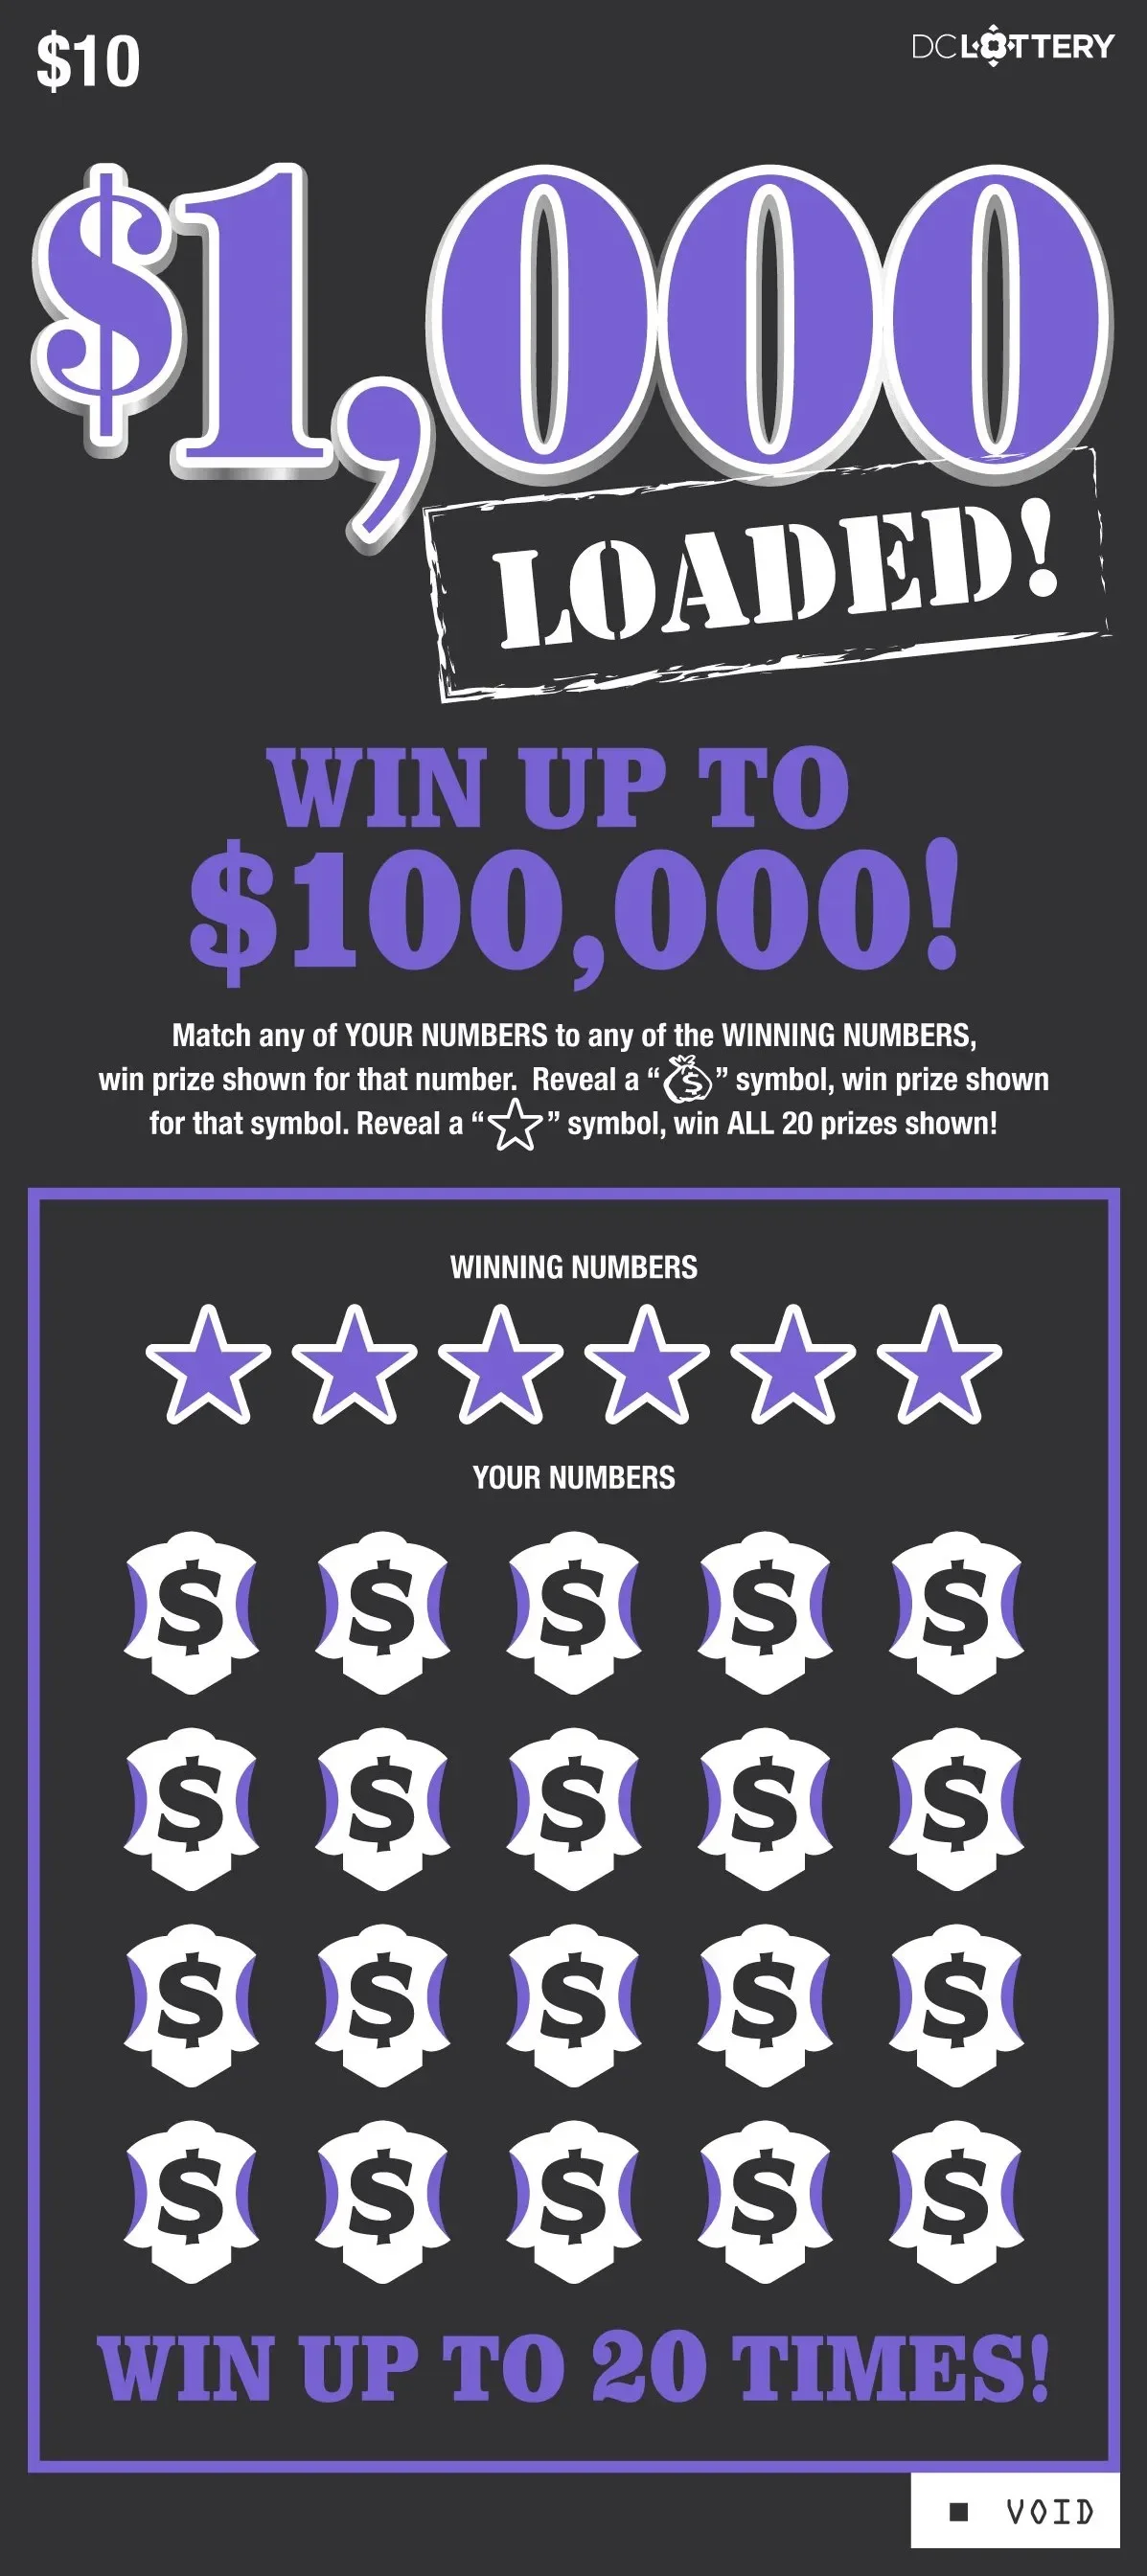 $1,000 Loaded $1,000 Loaded | $10 | 73.6% | $100,000 |
| 5 | 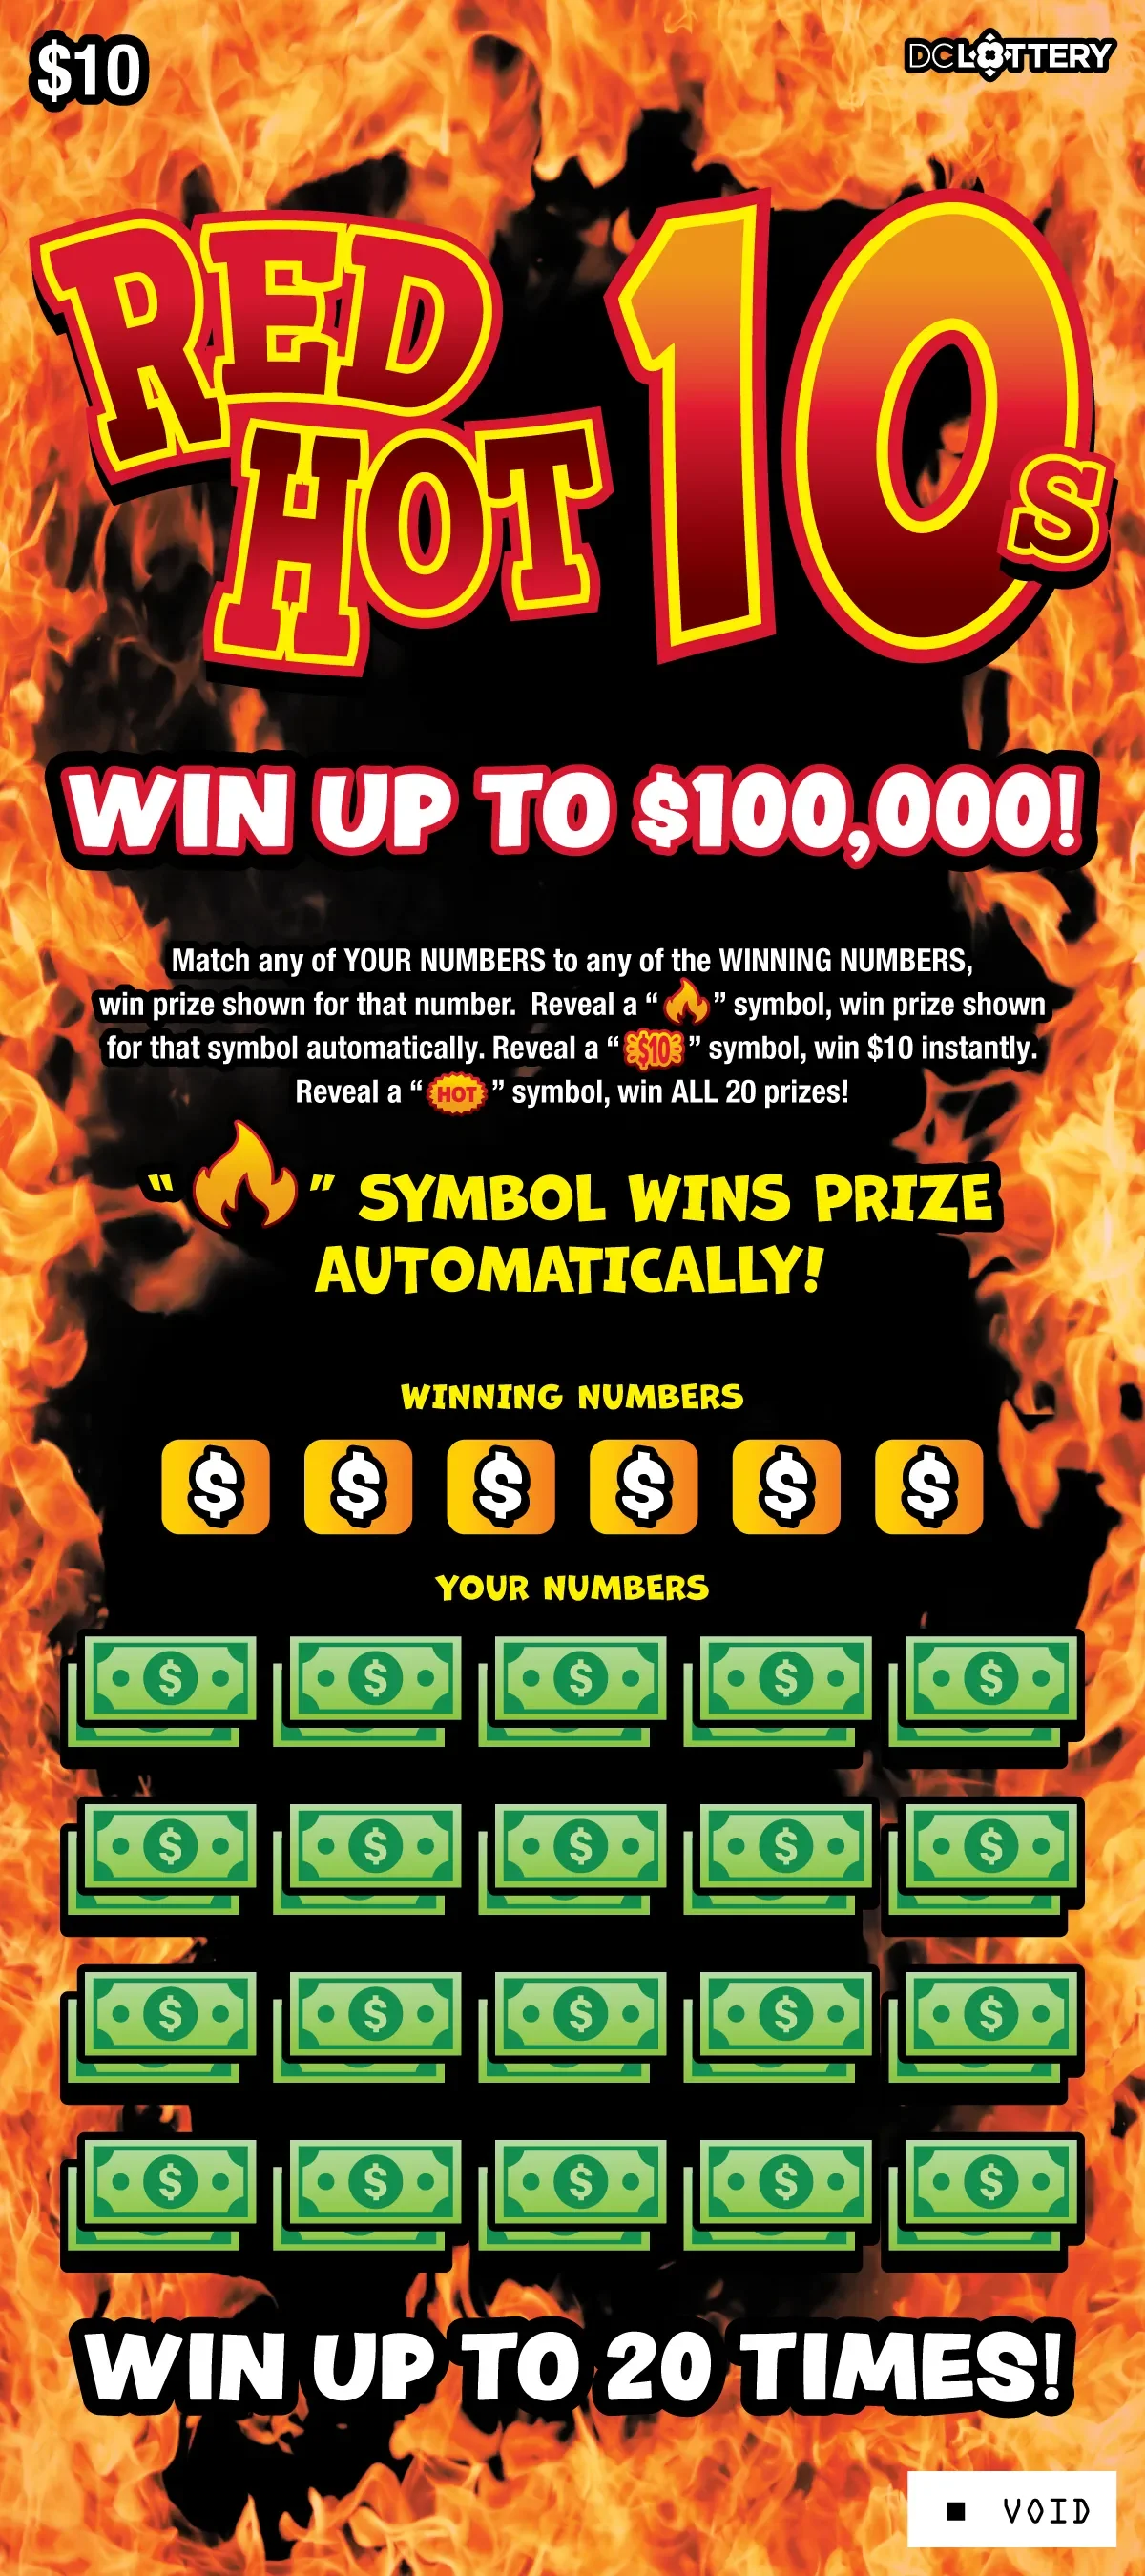 Red Hot 10s Red Hot 10s | $10 | 73.6% | $100,000 |
| 6 | 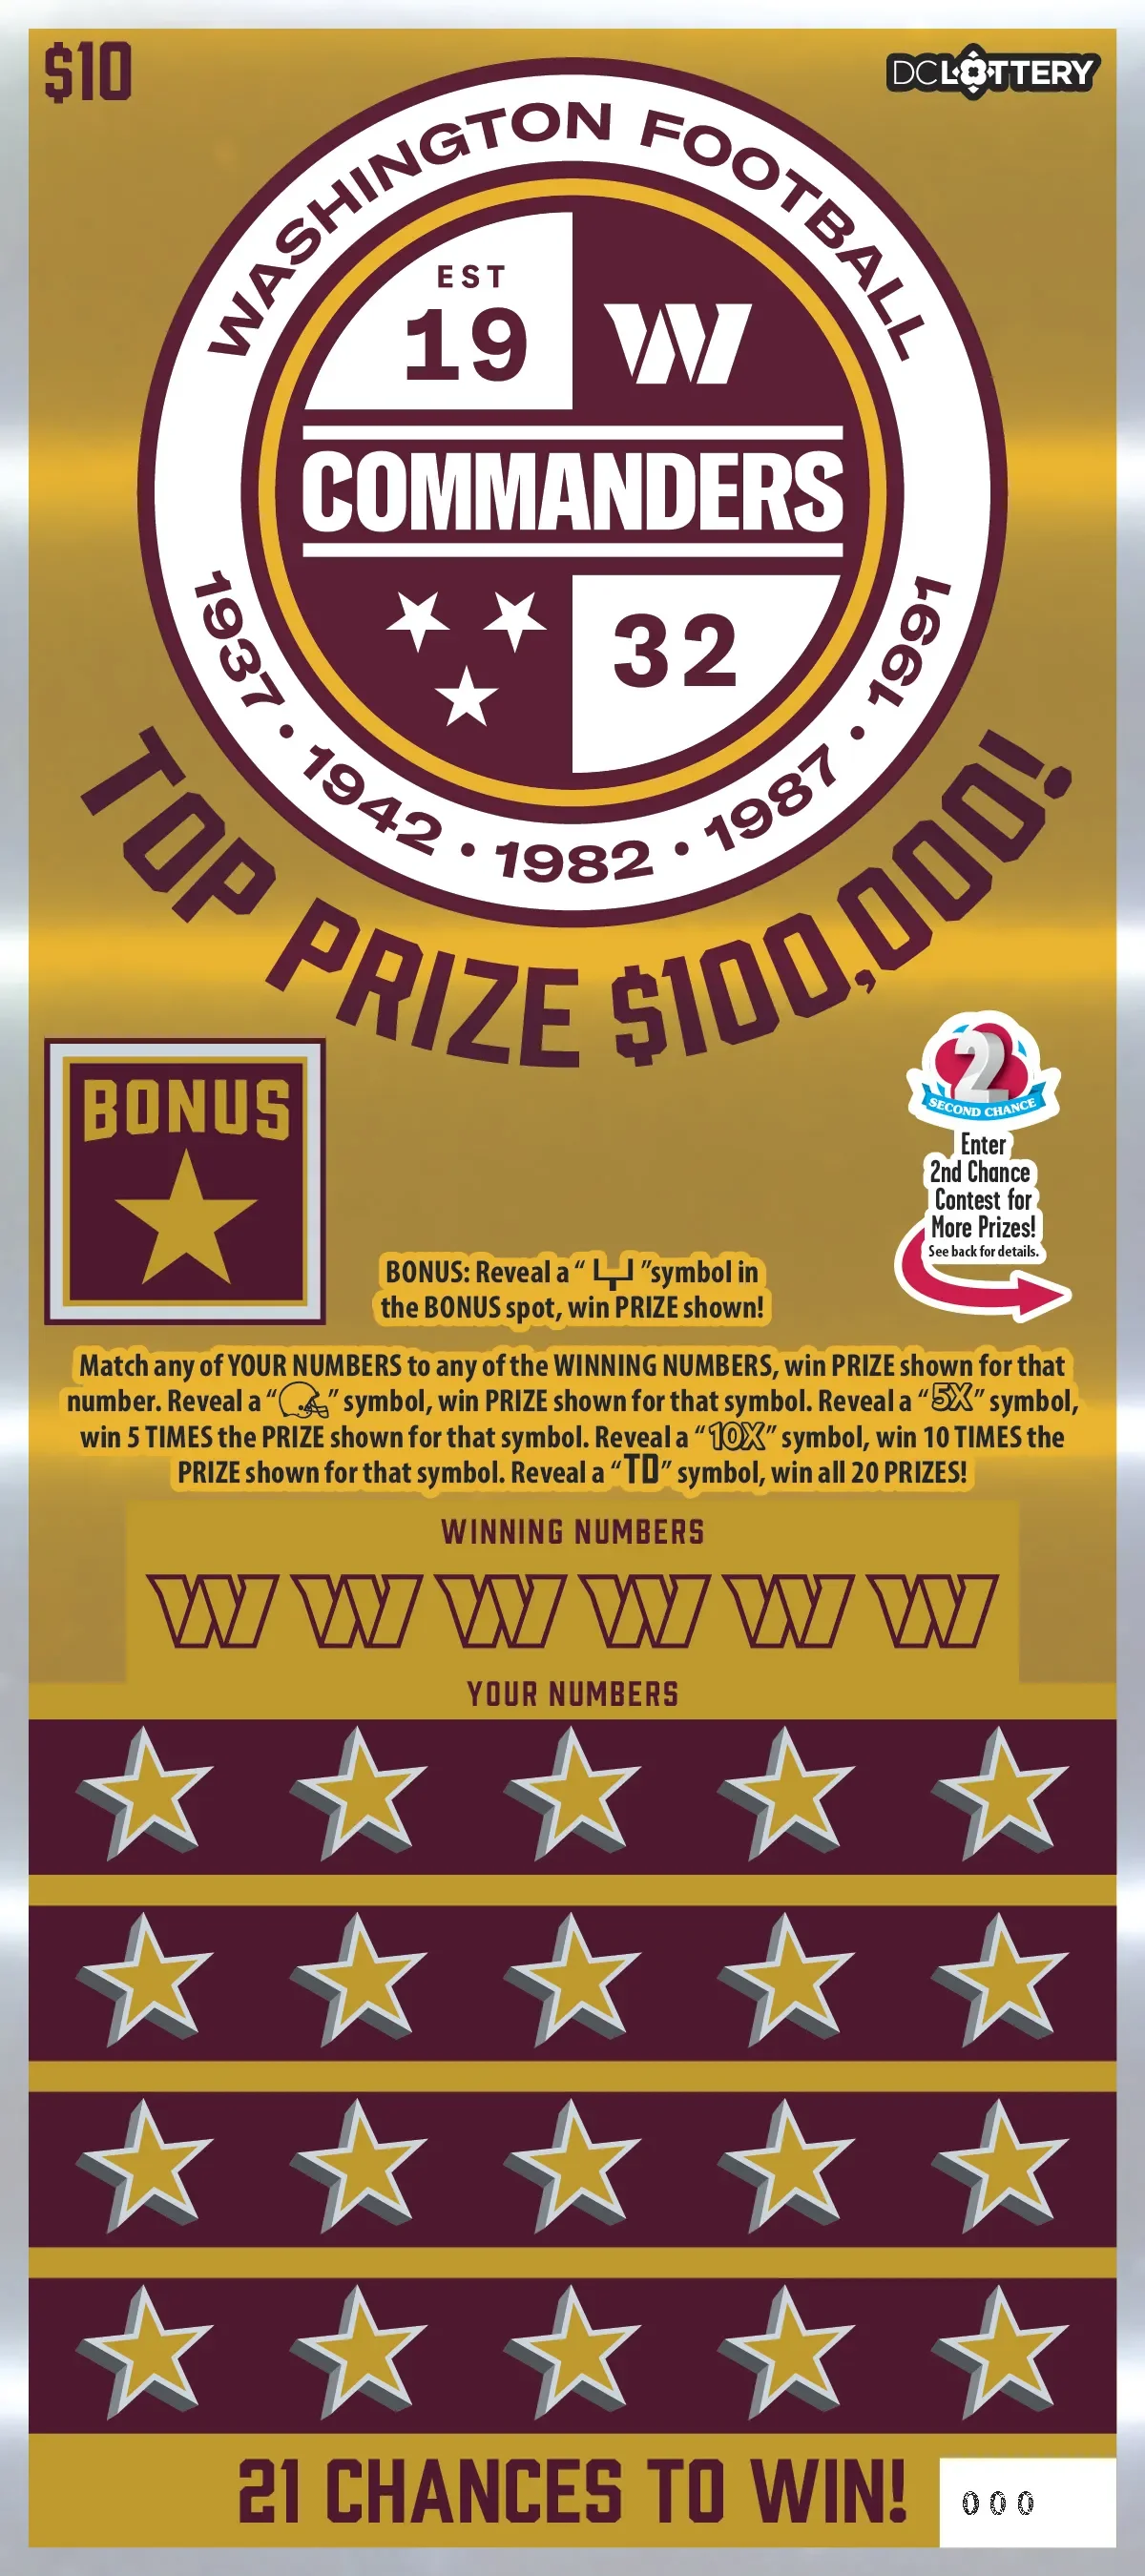 Washington Commanders Washington Commanders | $10 | 73.4% | $100,000 |
| 7 | 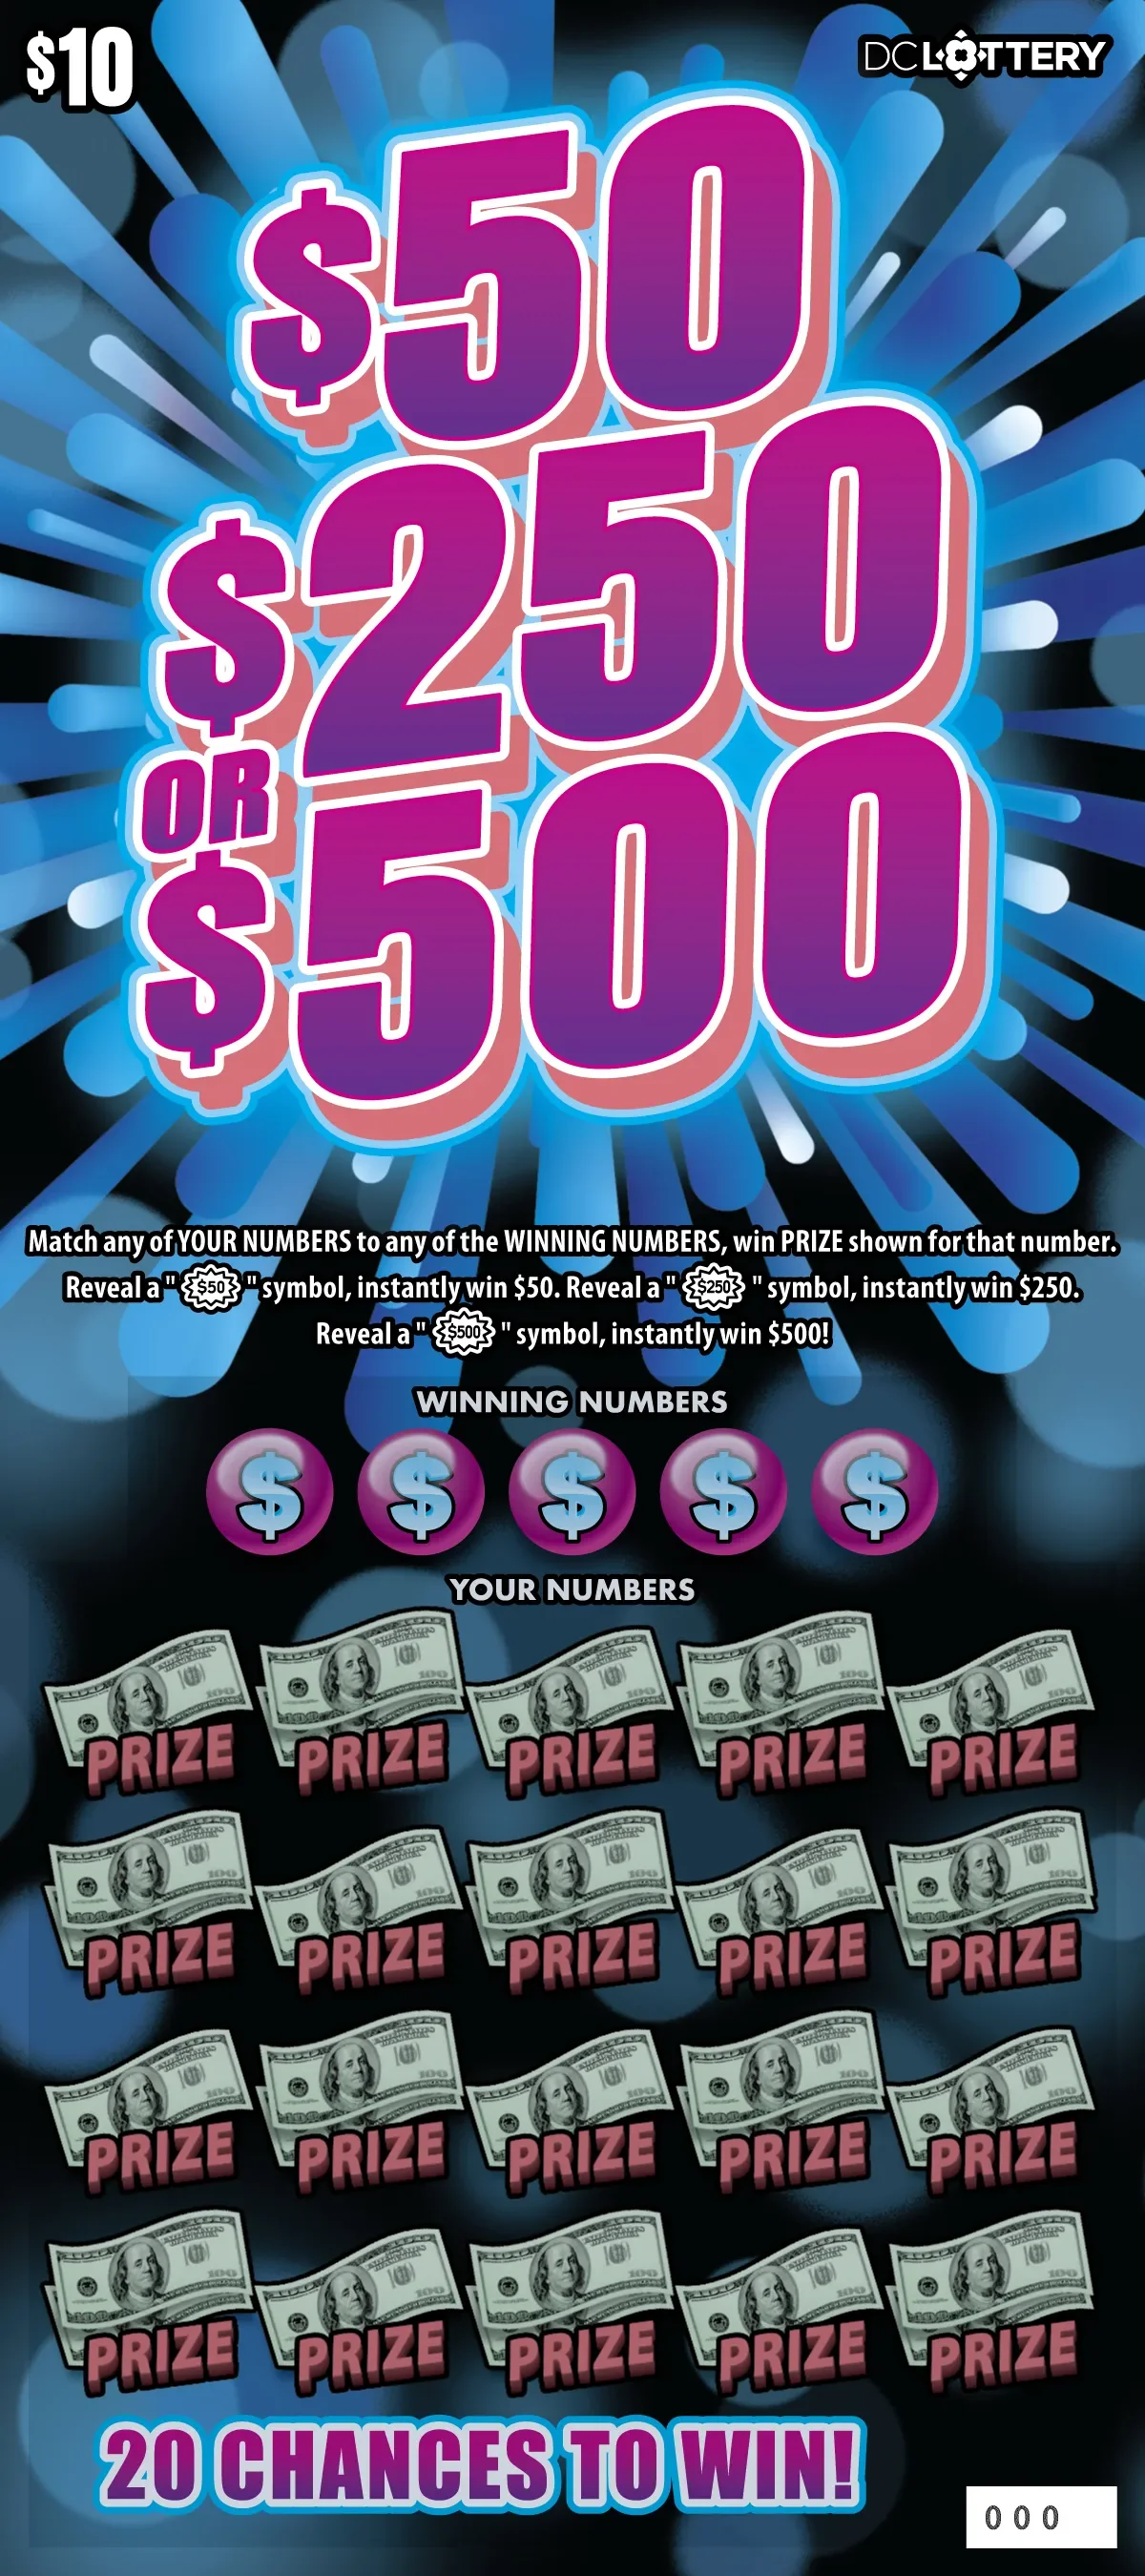 $50, $250 or $500 $50, $250 or $500 | $10 | 73.3% | $500 |
| 8 | 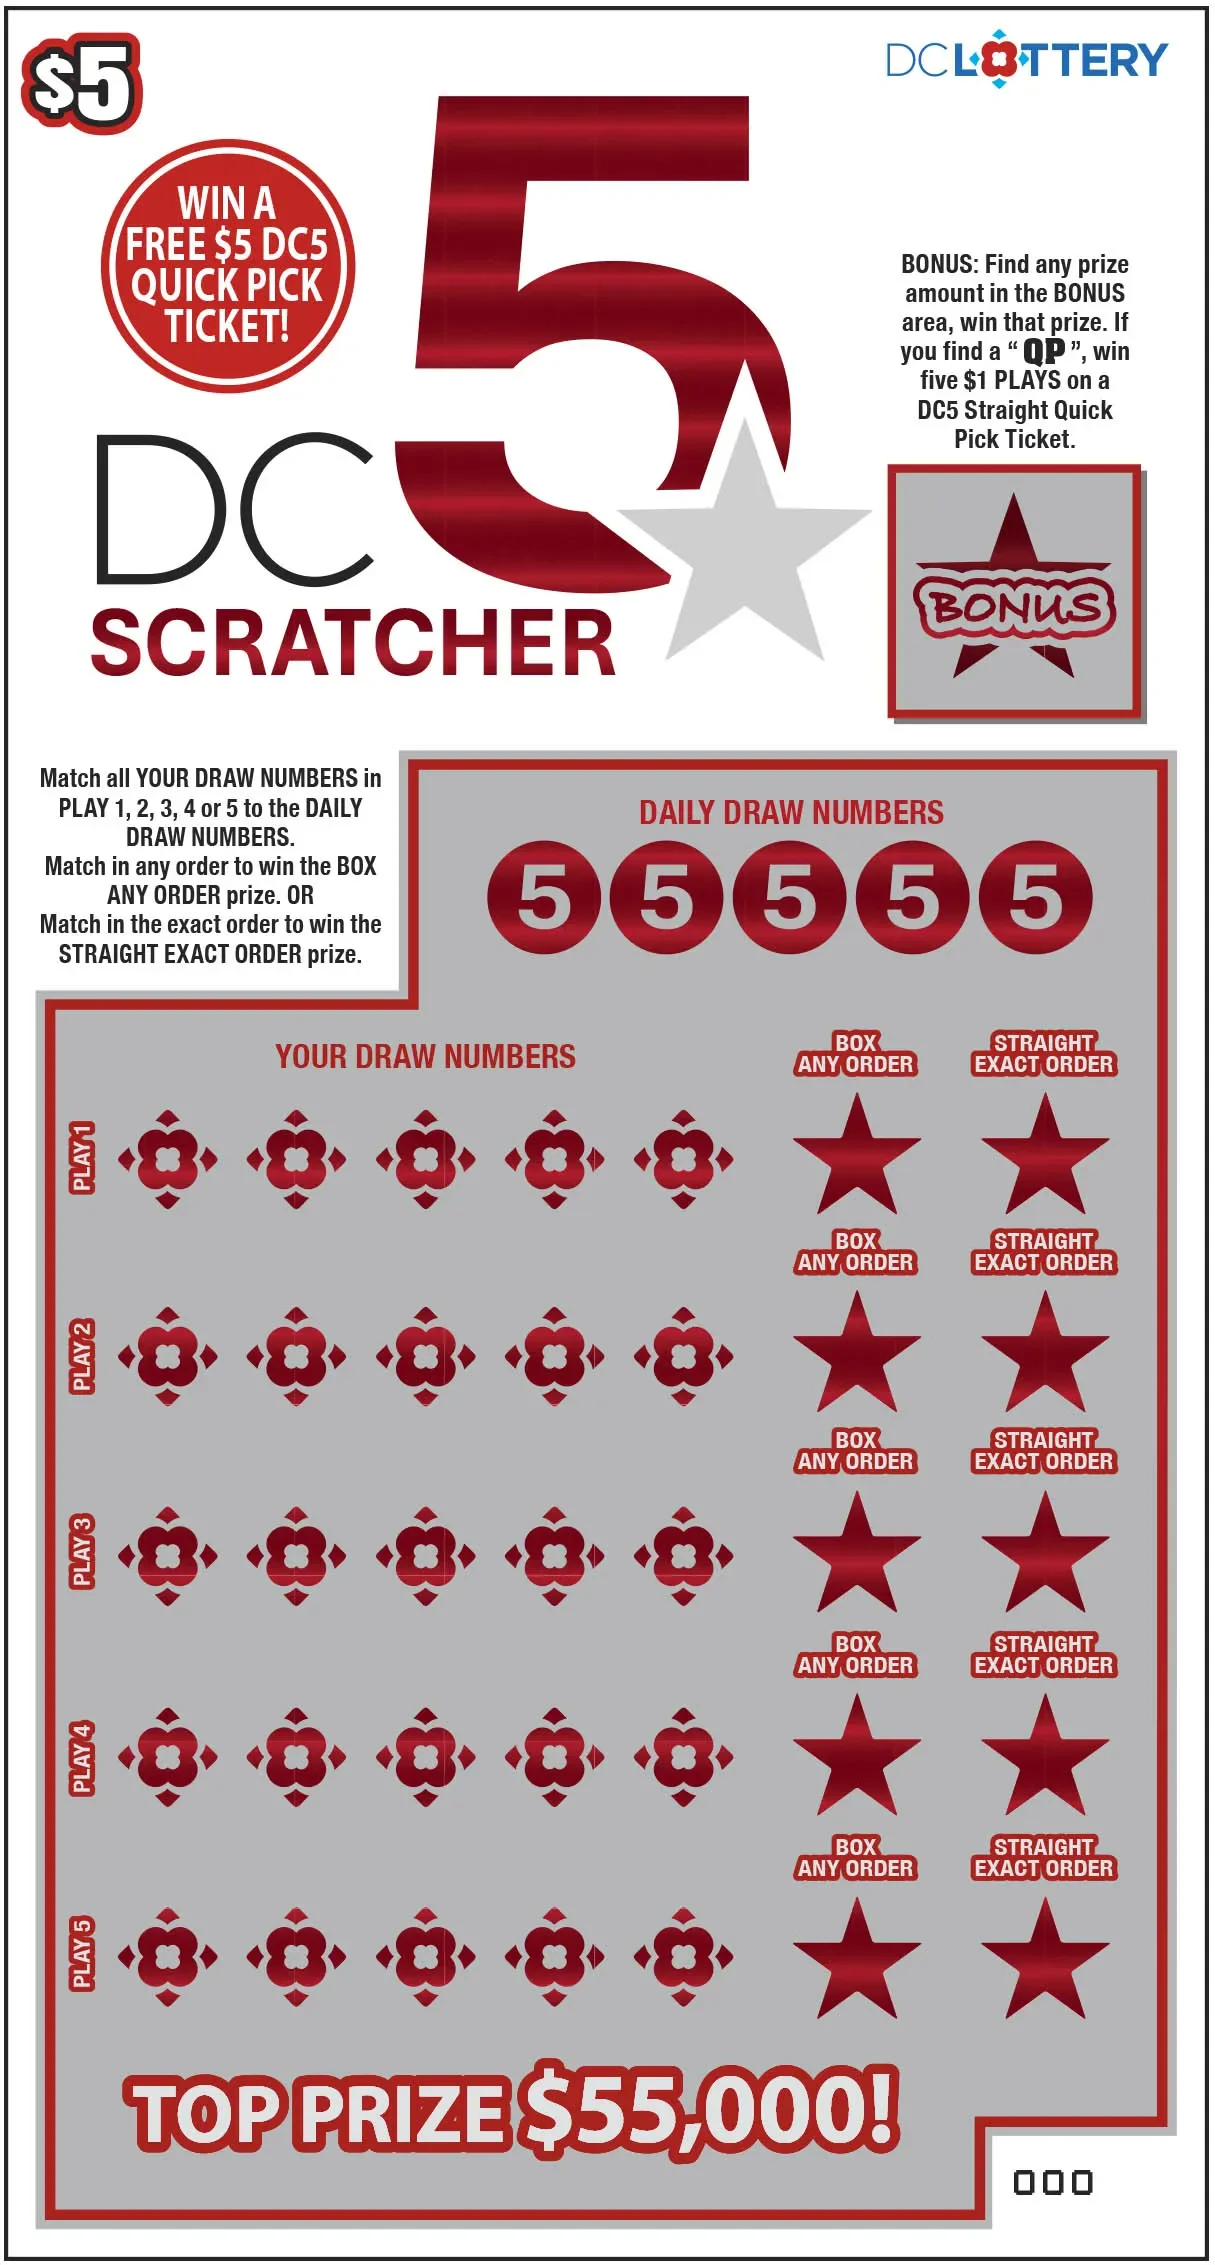 DC 5 Scratcher DC 5 Scratcher | $5 | 71.2% | $55,000 |
| 9 | 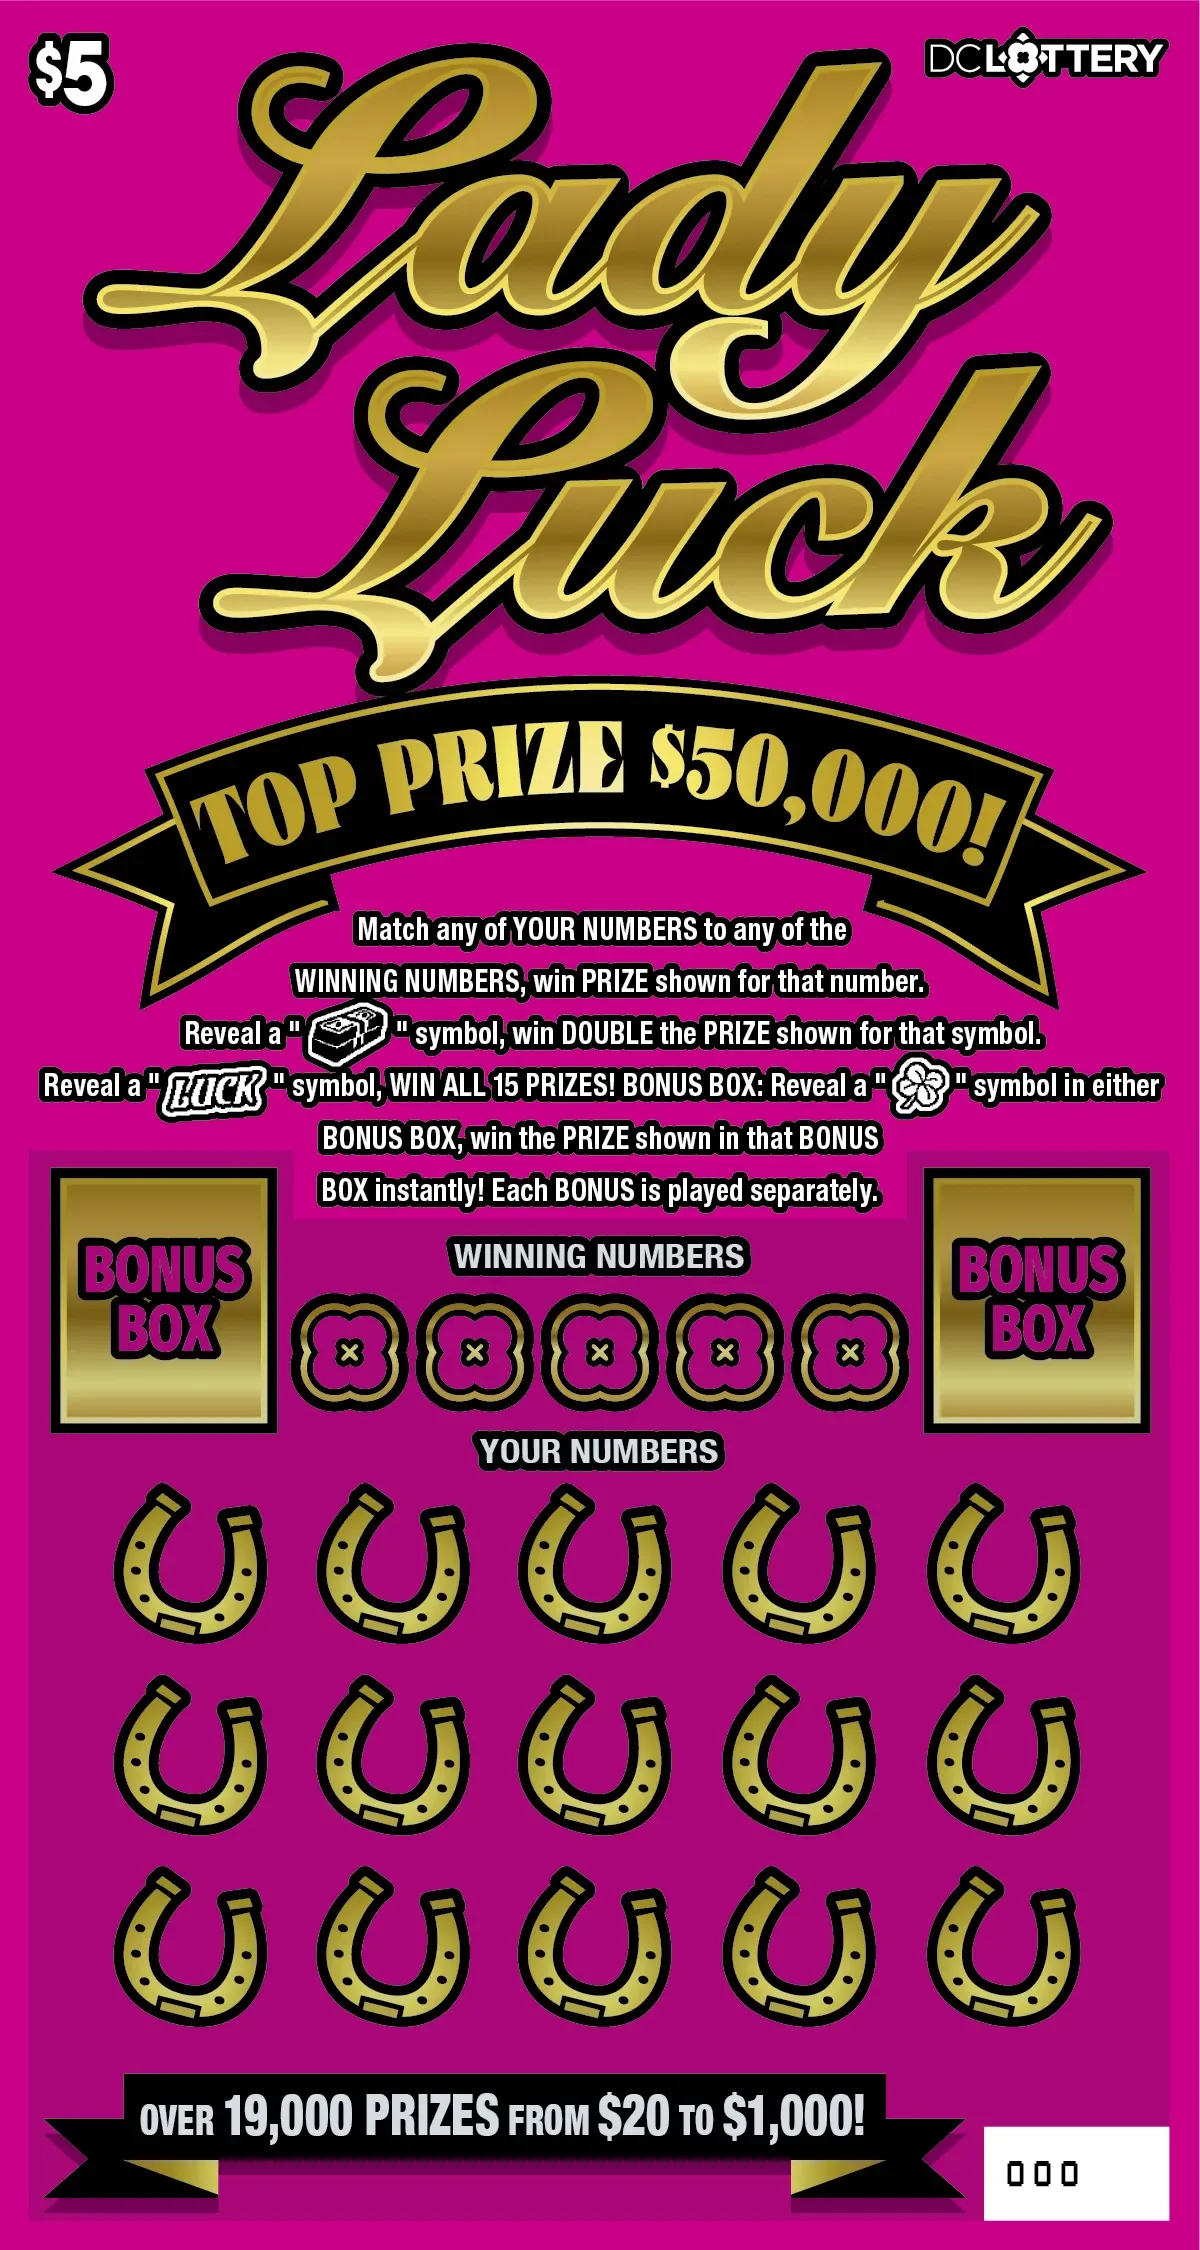 Lady Luck Lady Luck | $5 | 70.5% | $50,000 |
| 10 | 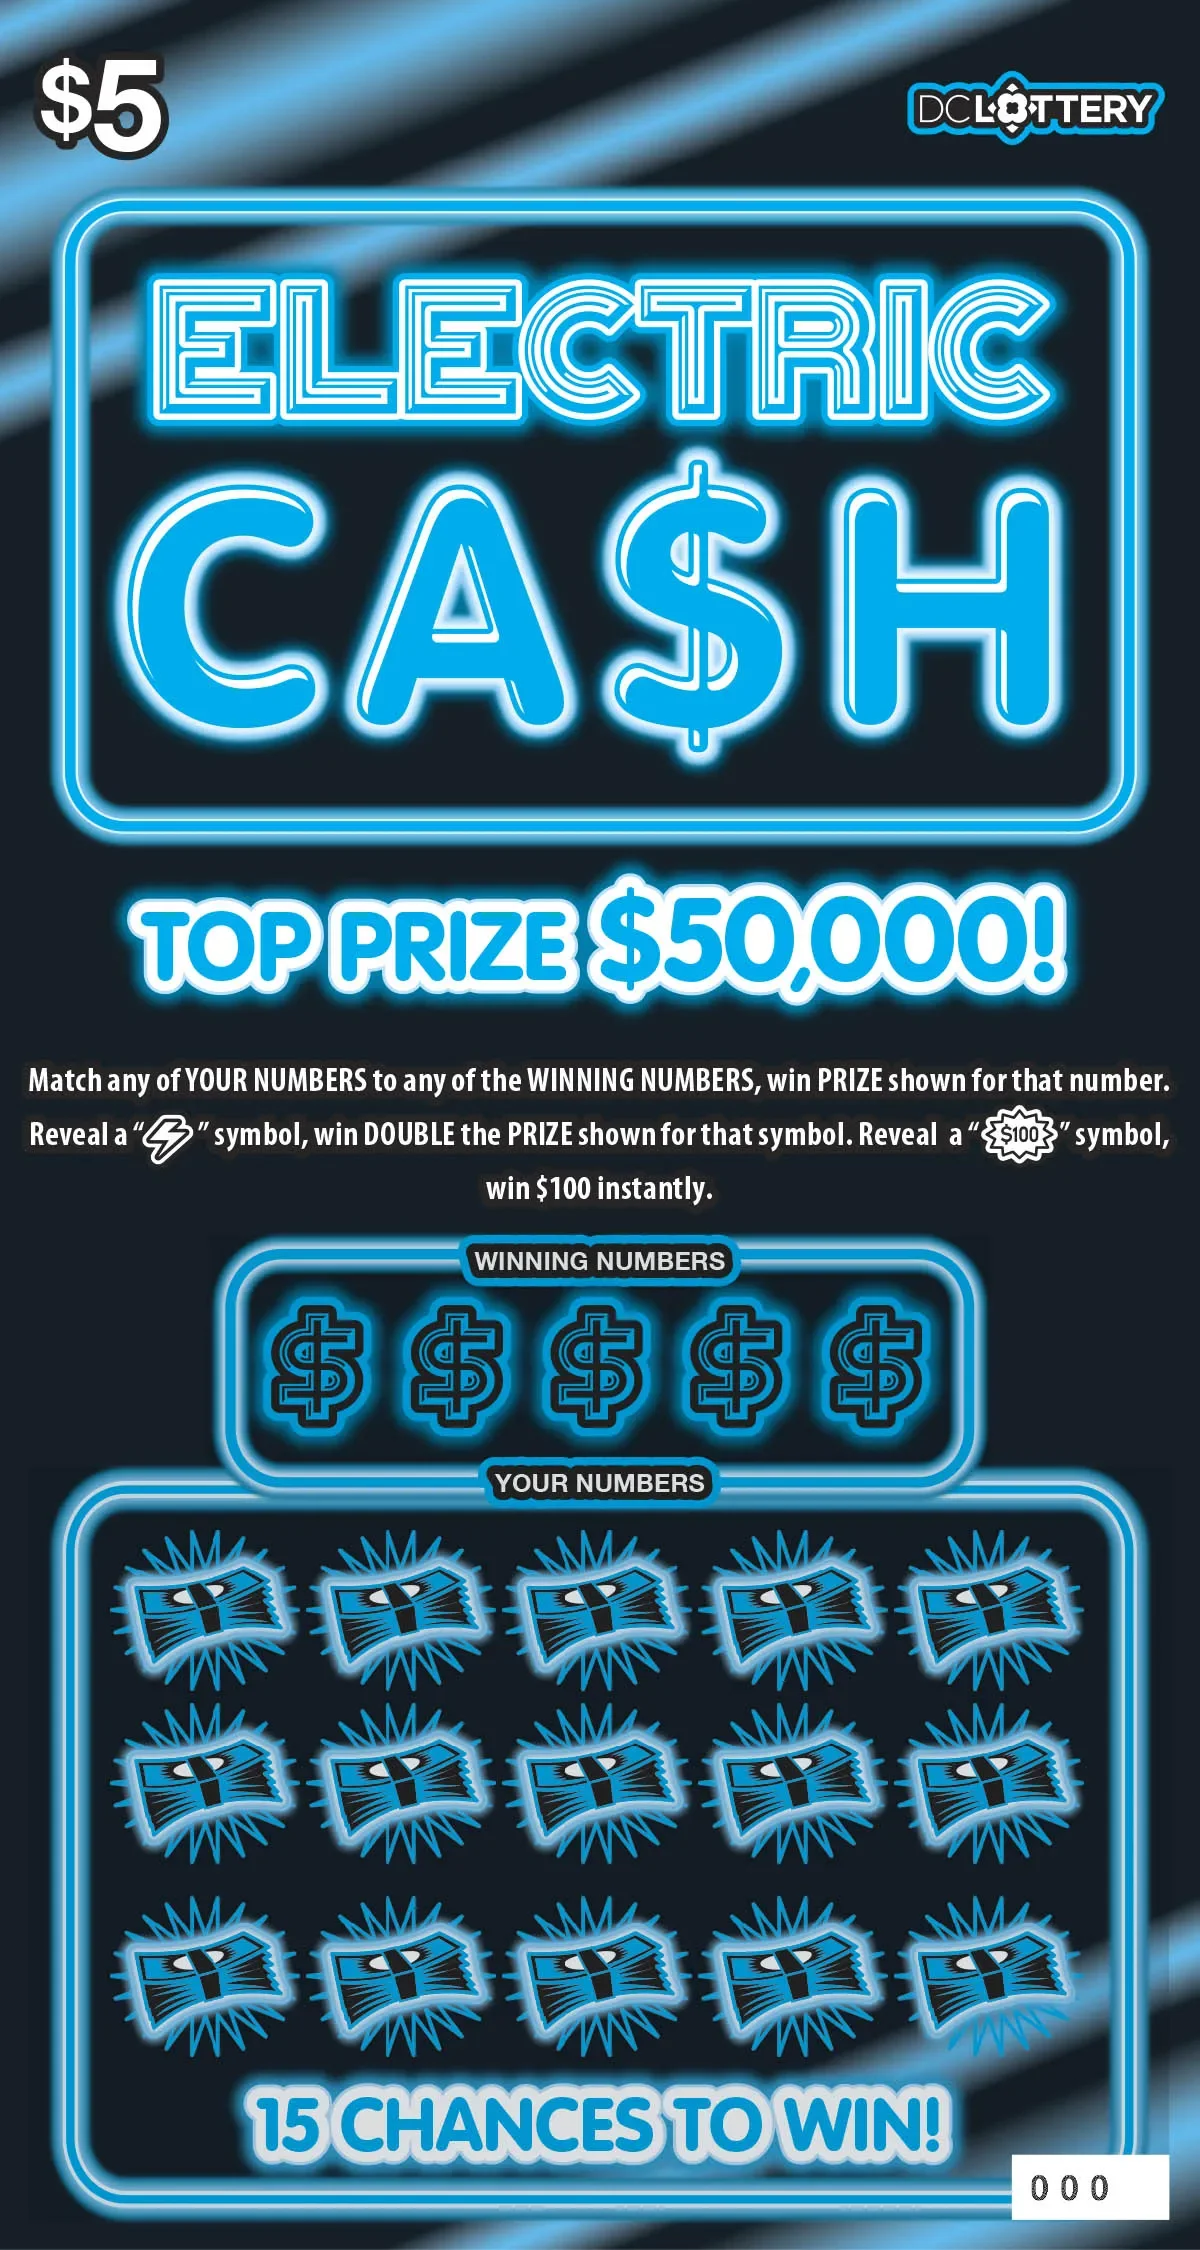 Electric Cash Electric Cash | $5 | 70.5% | $50,000 |
| 11 | 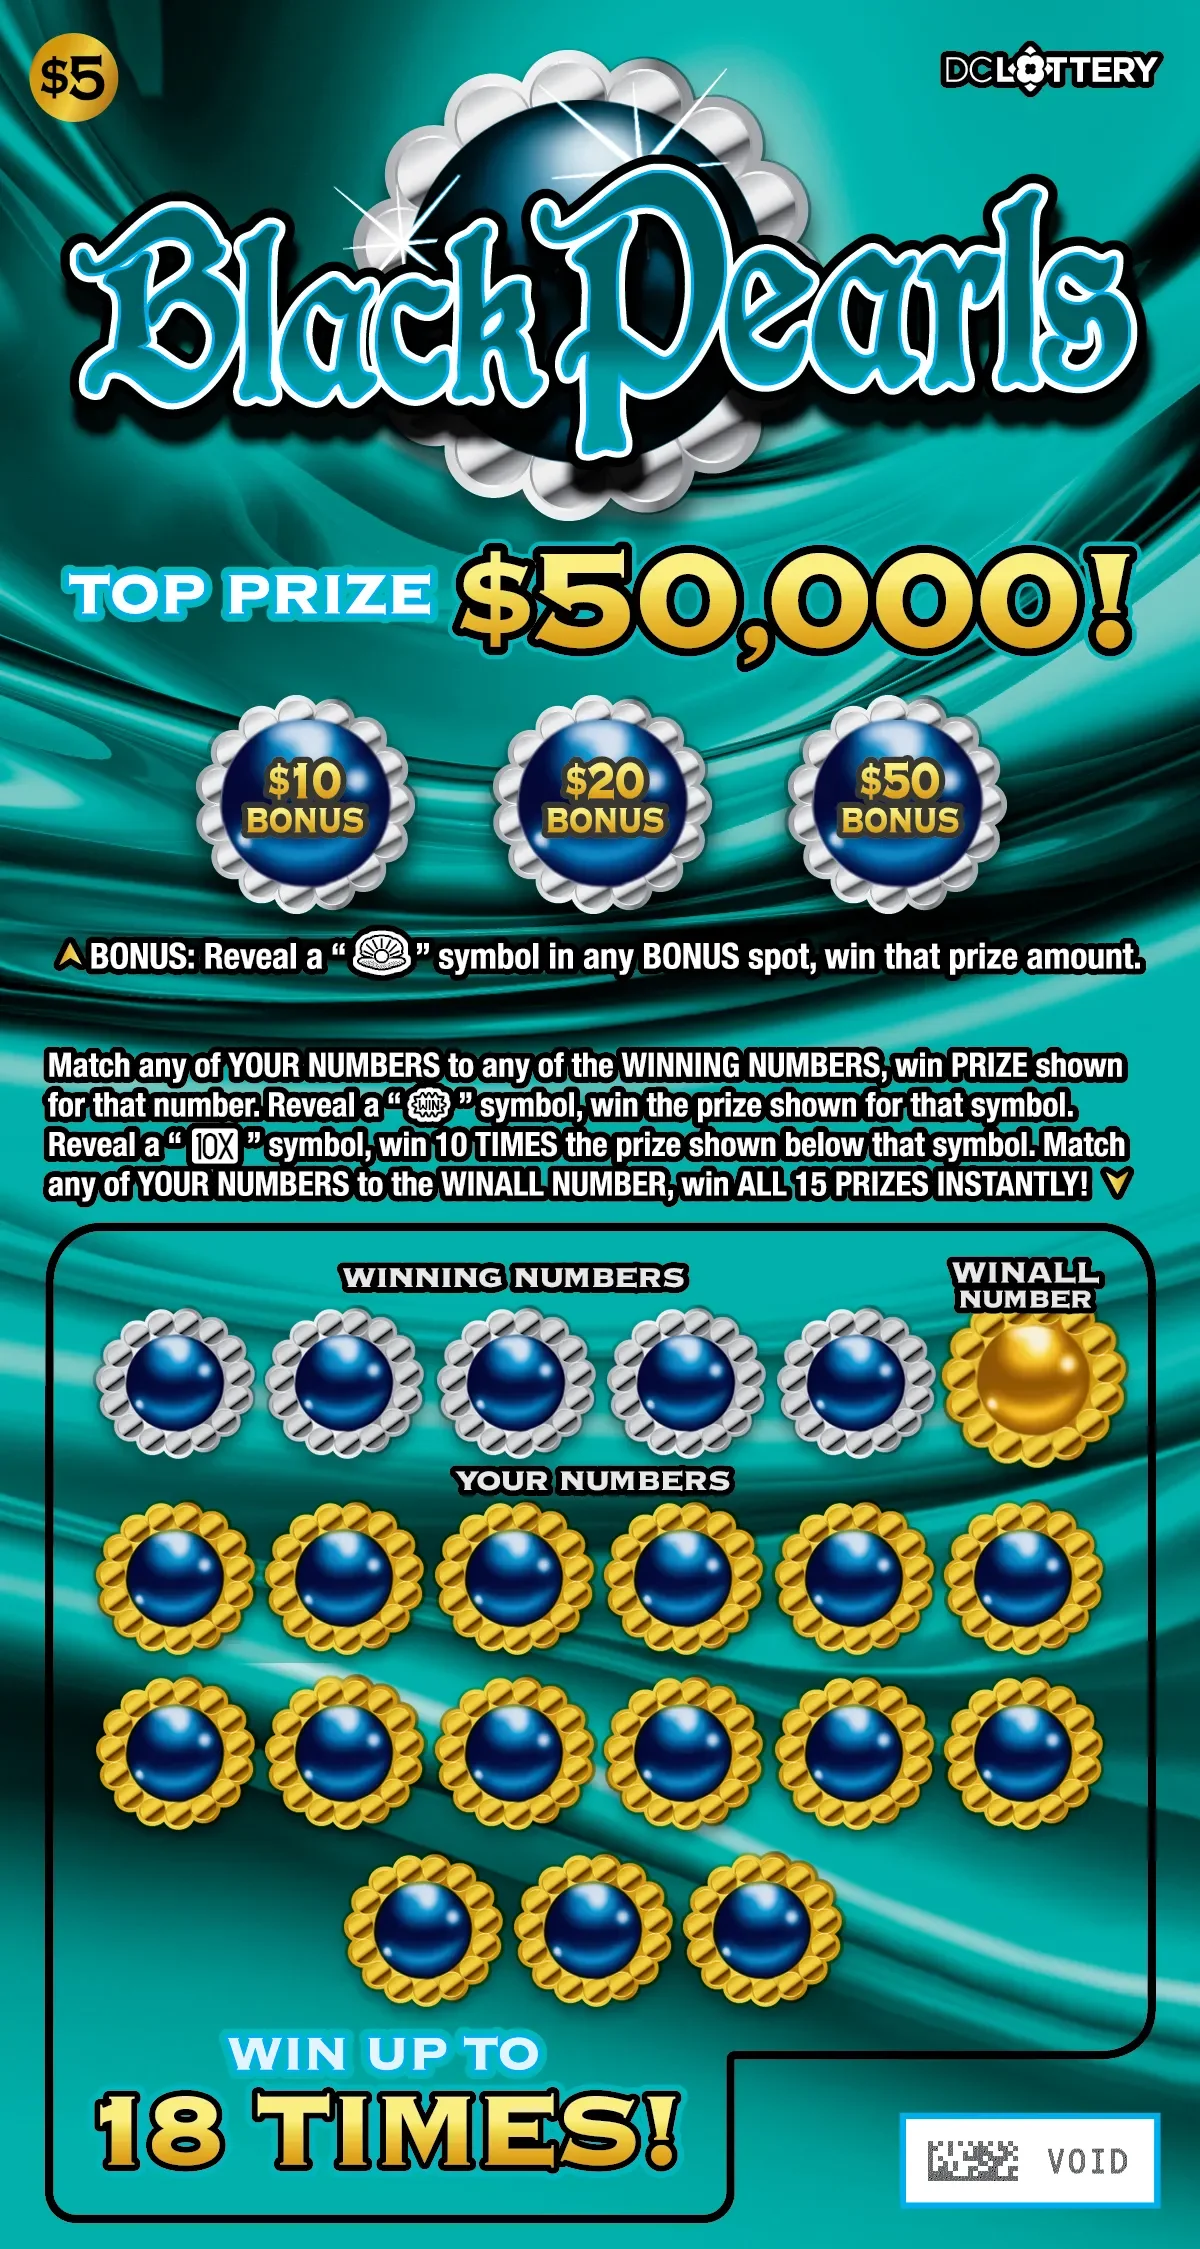 Black Pearls Black Pearls | $5 | 70.5% | $50,000 |
| 12 | 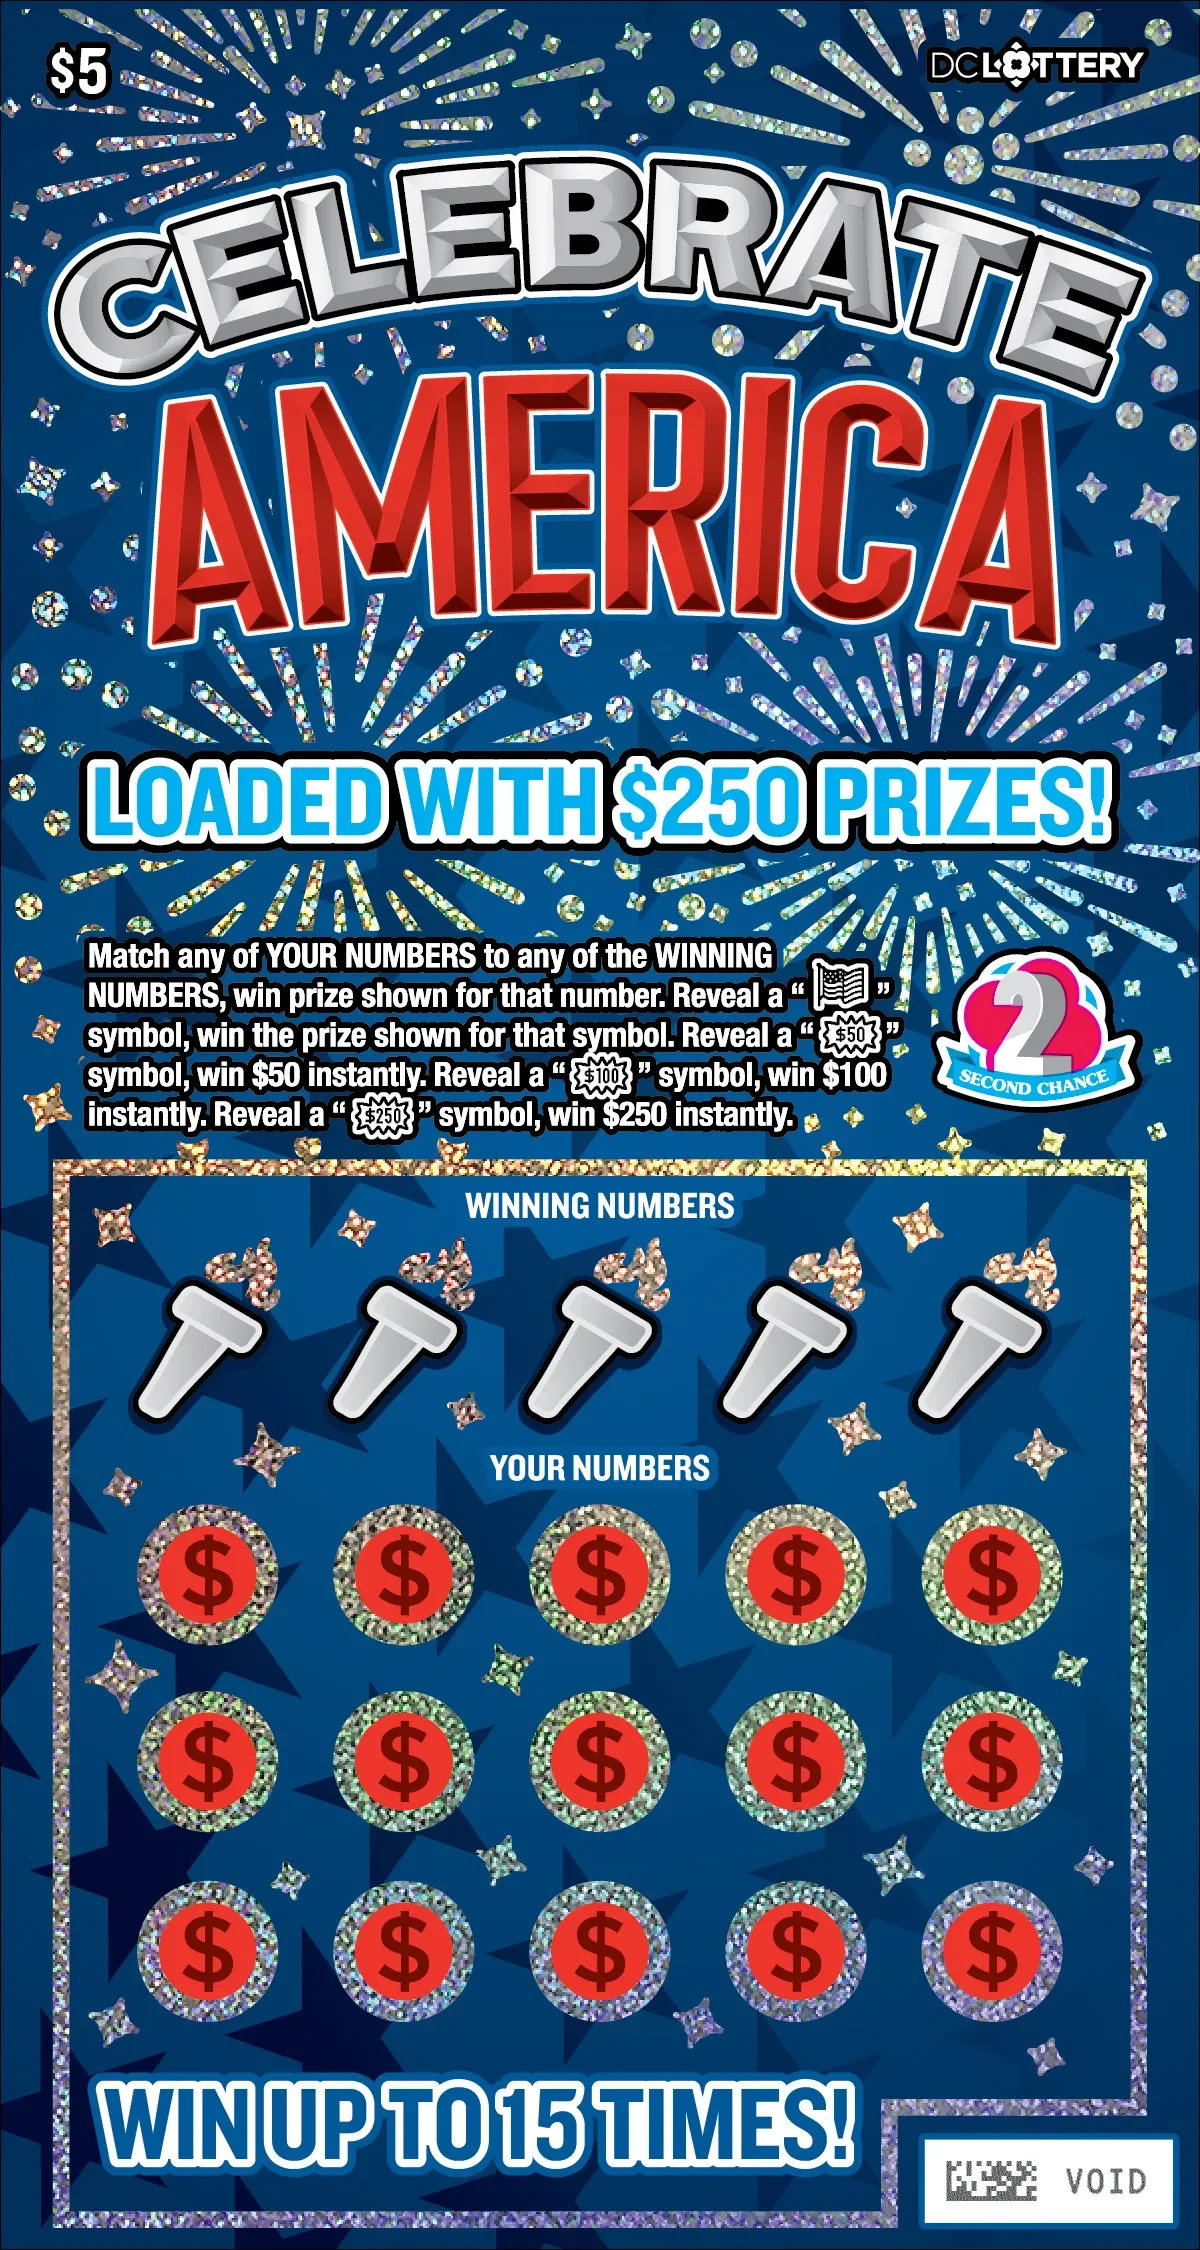 Celebrate America Celebrate America | $5 | 70.4% | $250 |
| 13 |  Washington Commanders Raise Hail Washington Commanders Raise Hail | $5 | 70.1% | $50,000 |
| 14 |  DC 4 Scratcher DC 4 Scratcher | $4 | 68.2% | $45,000 |
| 15 |  Quick 7s Quick 7s | $1 | 67.1% | $777 |
| 16 |  DC 3 Scratcher DC 3 Scratcher | $3 | 66.8% | $35,000 |
| 17 | 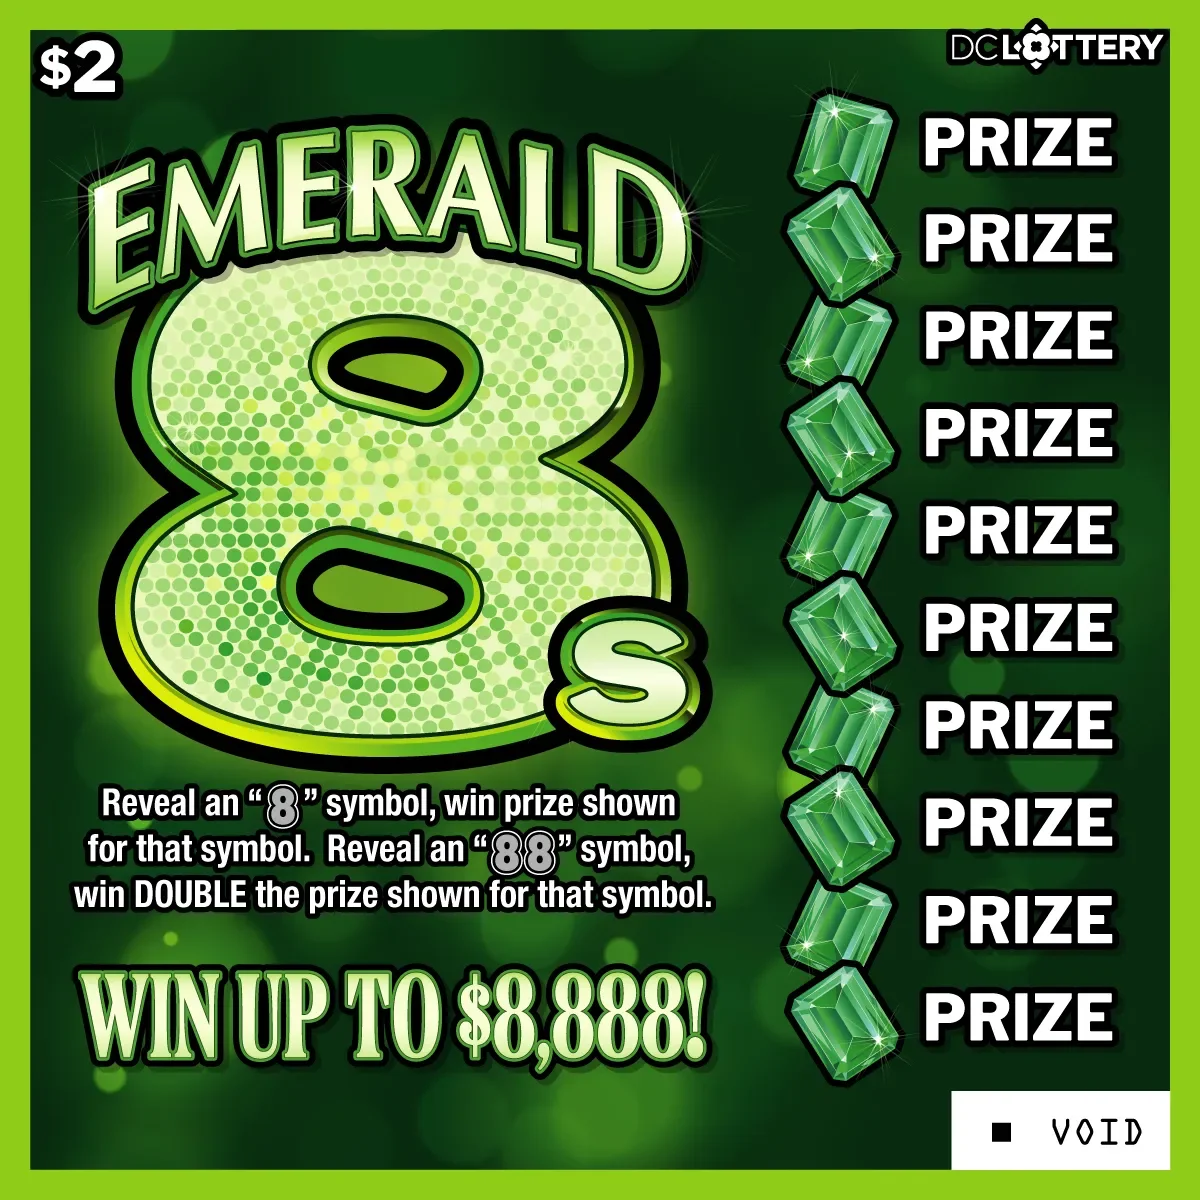 Emerald 8s Emerald 8s | $2 | 64.3% | $8,888 |
| 18 | 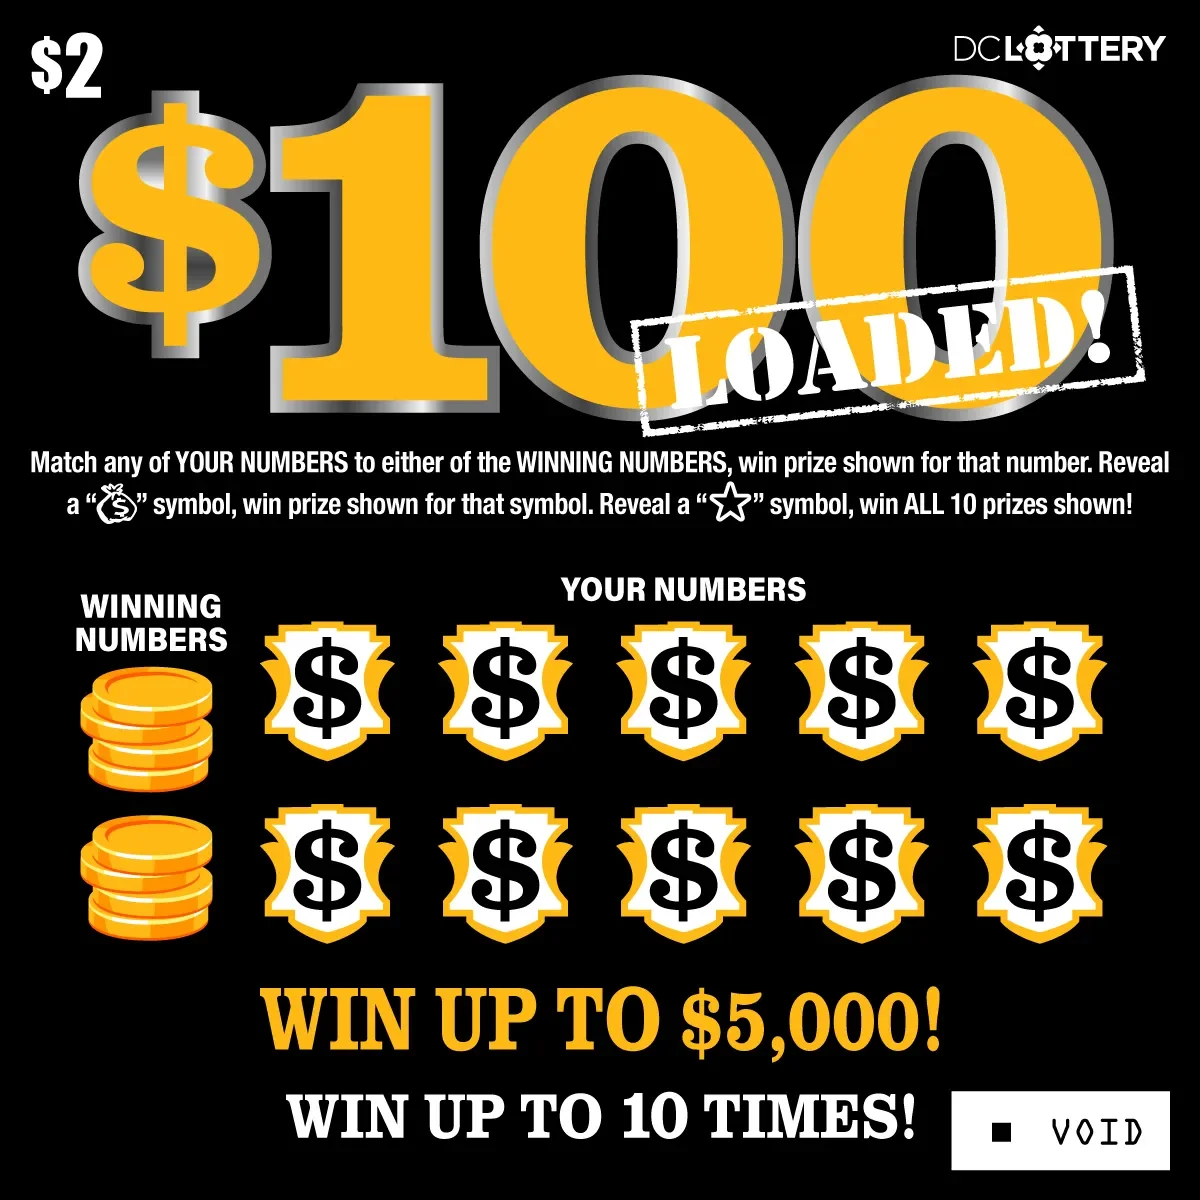 $100 Loaded! $100 Loaded! | $2 | 64.2% | $5,000 |
| 19 | 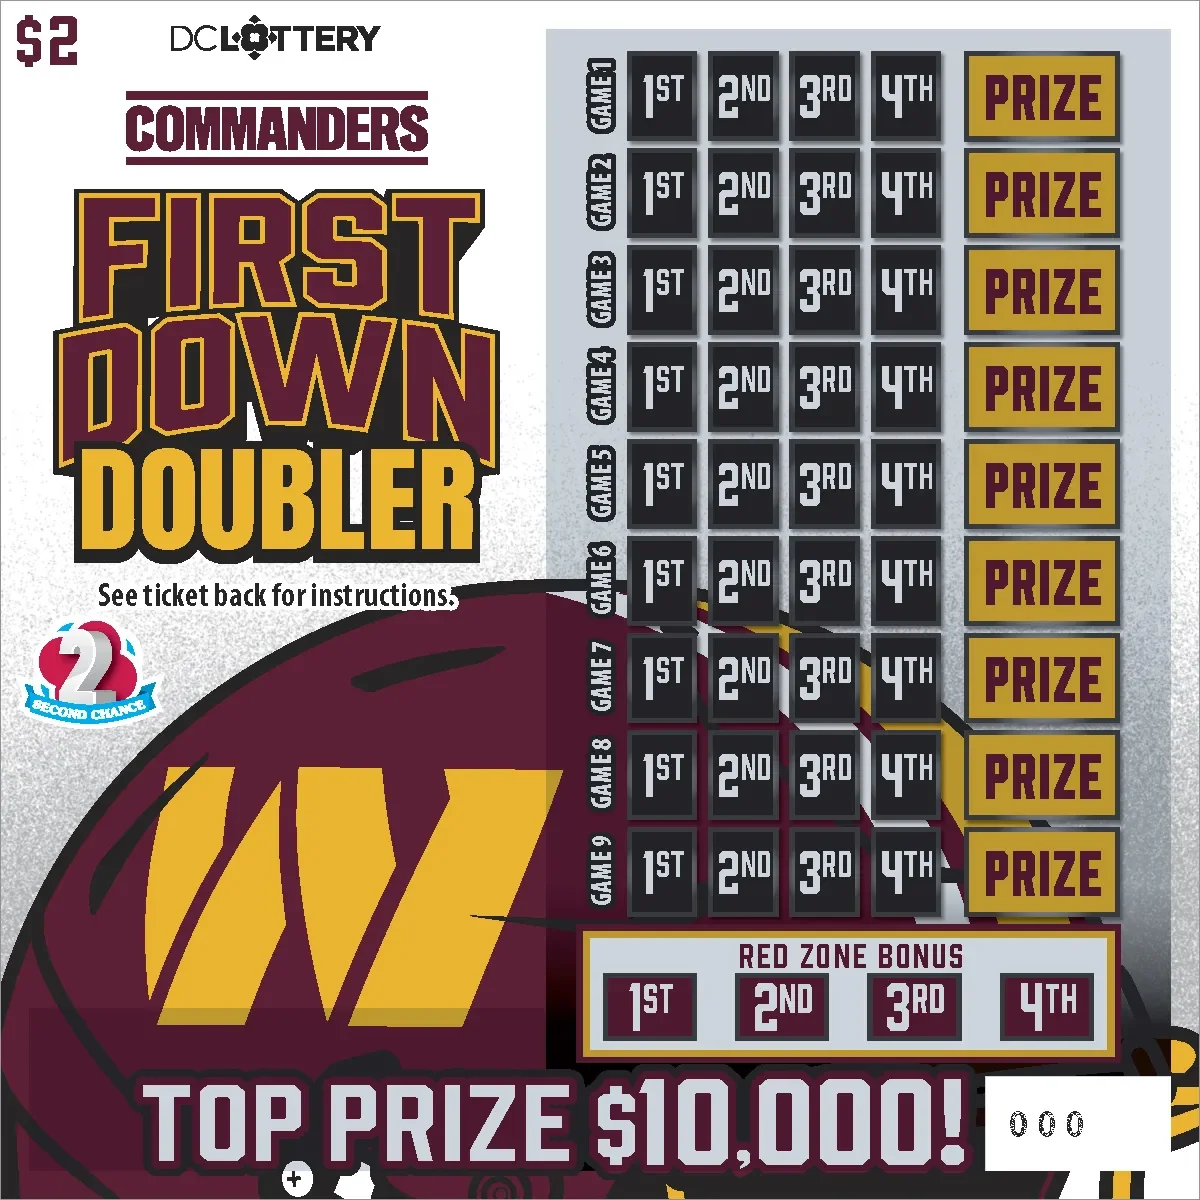 Commanders First Down Doubler Commanders First Down Doubler | $2 | 62.8% | $10,000 |
| 20 | 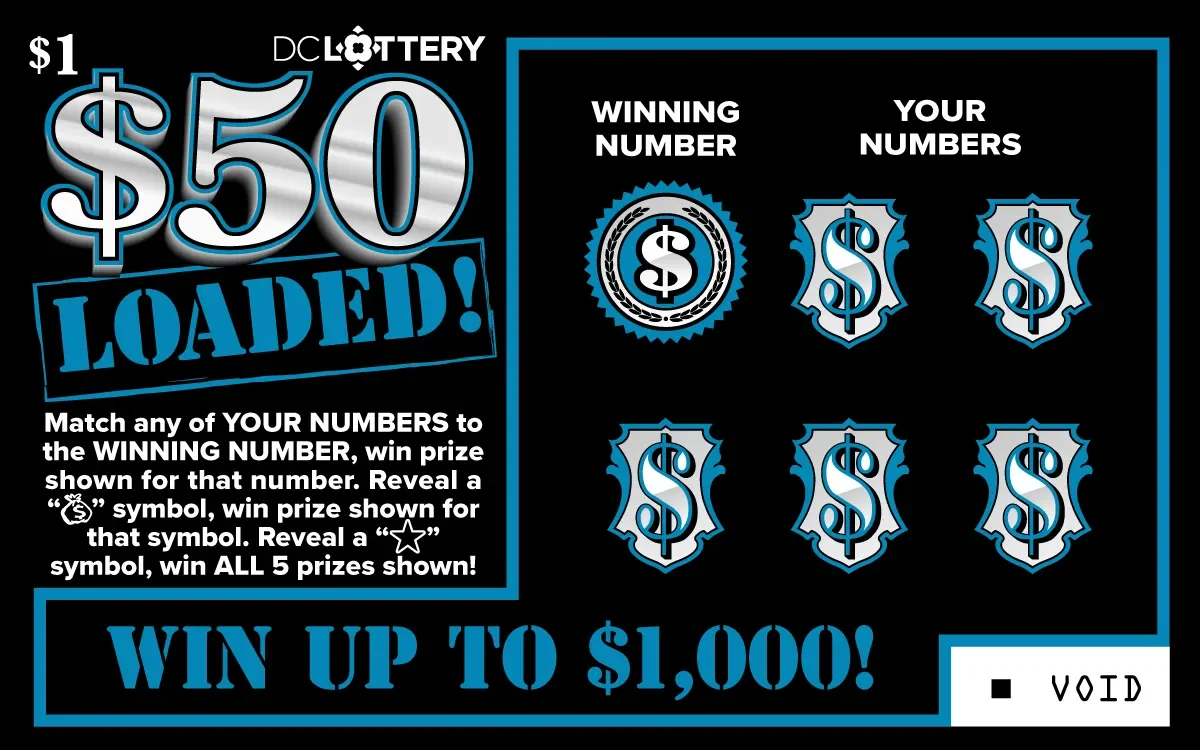 $50 Loaded! $50 Loaded! | $1 | 60.4% | $1,000 |
Frequently Asked Questions
What does the Highest Prize Payout ranking measure?
Prize Payout is the share of every ticket-sale dollar the state returns as prizes, across all tiers. A higher payout percentage means more of the money goes back to players. State lotteries typically keep 25 to 40%; payouts above 70% are unusually generous.
Which Washington DC scratch-off is currently #1 for highest prize payout?
The VIP Club ($30) currently ranks first with overall odds of 1 in 3.33 (ValueScore 97 of 100). Prize payout is 78.5%. Rankings update automatically as prize counts change, so the top pick can move. Open the game page for the full prize-tier breakdown and remaining counts.
How often does this ranking update?
Game data for Washington DC is refreshed from official sources on a daily schedule. Whenever remaining-prize counts change, ValueScore and every dependent ranking are recomputed automatically. The "updated daily" stamp on the page reflects the most recent successful update.
How should I pick between the top few games in Washington DC?
Rankings are a starting point, not a verdict. Two tickets that sit next to each other often differ on a dimension the headline metric ignores: price, top-prize size, or remaining inventory. Use the Budget & Goal Optimizer or the side-by-side Compare tool to weigh Breakeven probability, Jackpot Chase value, or published EV against your actual spend and goal.
Are these values official or estimated?
ScratchCheck uses official published odds and prize counts wherever the state makes them available. A small number of states publish only limited prize breakdowns; for those games ScratchCheck estimates Expected Value and related metrics from industry price-point averages and flags them with an "~Est." tag next to the number. Official figures always take precedence.