Scratch-Offs Are 70% of all Lottery Revenue. Here's Why
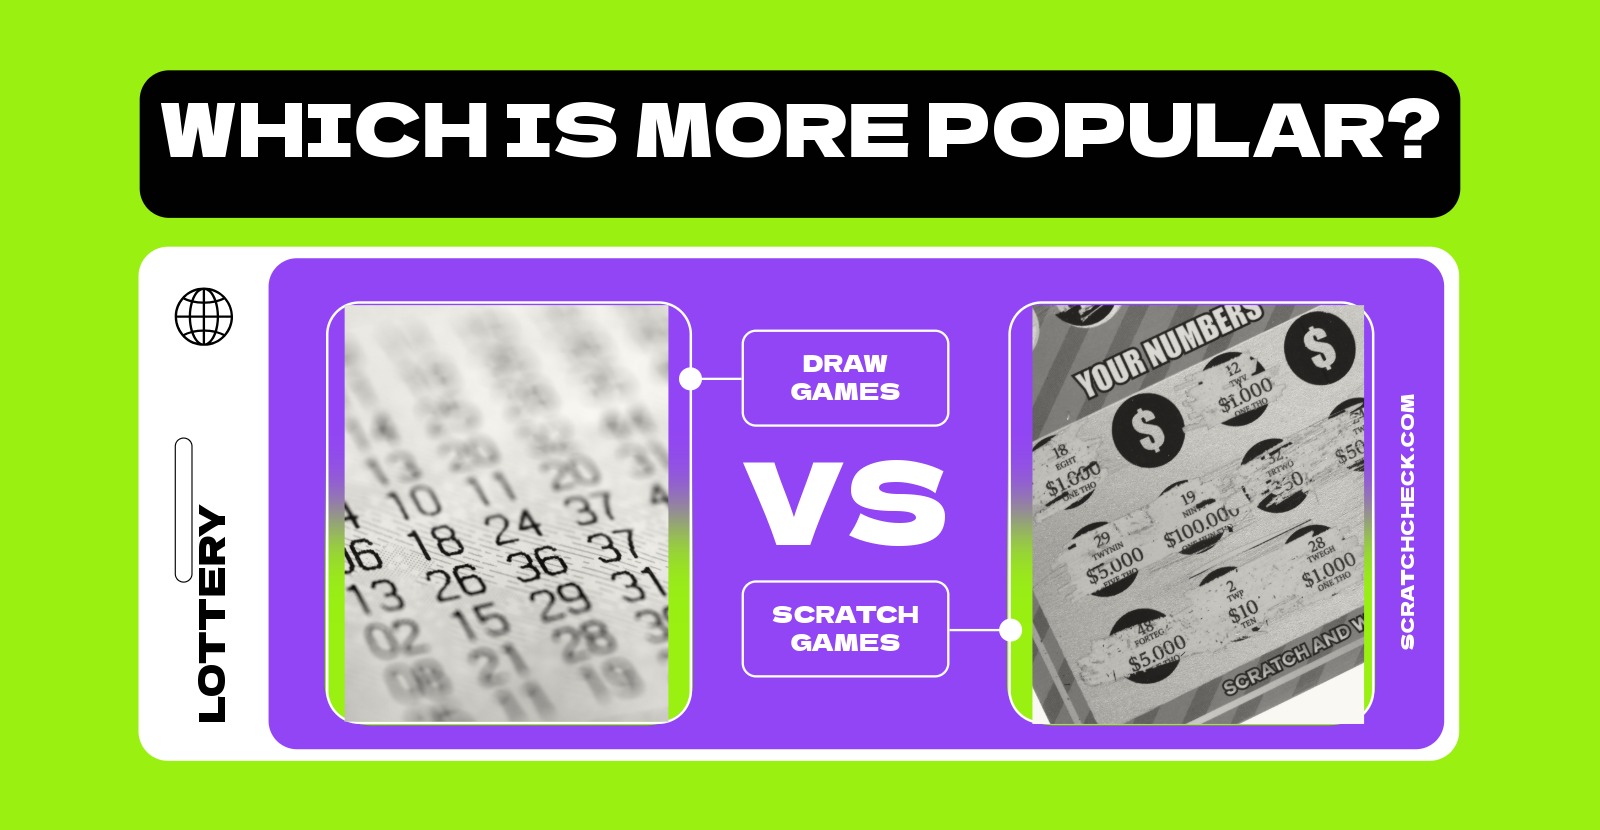
Draw Games or Scratch-offs, which is more popular? The answer is Scratch-offs and it's not particularly close; the gap has been widening for years. Most people assume Powerball and Mega Millions are the lottery's main product because they generate the biggest headlines and the largest individual prizes. But in terms of actual dollars spent, scratch-off tickets dominate every major state's lottery revenue, and by a margin that surprises most players when they see the numbers.
The National Split
According to ScratchSmarter's 2025 state spending analysis, scratch-off games account for roughly 65-75% of total lottery revenue in most states, a share that has grown steadily over the past decade. Industry research firm Technavio valued the scratch-off games segment at $63 billion in 2024. That single figure exceeds the combined annual revenue of the NFL, NBA, MLB, and NHL by a significant margin.
The remaining 25-35% of lottery revenue covers all draw games combined: Powerball, Mega Millions, Pick 3, Pick 4, Keno, state lotto games, and everything else that involves waiting for a drawing. Powerball and Mega Millions together represent a fraction of that already-smaller slice.
According to Scientific Games' FY2025 Data in Motion report, US lottery sales totaled $91 billion in fiscal year 2025, down 5.6% from fiscal year 2024. The entire decline came from draw games. Instant scratch games were essentially flat year over year. Draw game sales fell 41.2% in FY2025, the sharpest decline since FY2020, driven primarily by the absence of the billion-dollar jackpots that defined FY2023 and FY2024. Scratch-off sales barely moved.
State-by-State: Scratch-Offs Dominate Almost Everywhere
Tennessee is the most extreme case. According to ScratchSmarter's state data, instant tickets represent 89.66% of Tennessee's total lottery sales, the highest share in the country. Draw games have a minimal footprint there. According to Lottery USA, New Jersey scratch-offs generated $1.8 billion in FY2025, more than half of the lottery's total revenue, in a year when Powerball and Mega Millions jackpots stayed relatively modest.
According to the Texas Lottery's official FY2025 press release, Texas generated $7.91 billion in total lottery sales in fiscal year 2025. The release specifically cited "the absence of large multi-state jackpots" as a major factor behind lower overall performance, because fewer billion-dollar jackpots meant lower Powerball and Mega Millions participation. The scratch-off side of the Texas business was comparatively stable.
According to ScratchSmarter's Washington Lottery statistics, Washington scratch-offs accounted for 77% of all Washington Lottery revenue in 2025, generating over $850 million of the state's $1.1 billion in total lottery sales. Per capita scratch-off spending in Washington reached $140 in 2025, up 48% from $110 in 2017.
Massachusetts leads all states on per capita scratch-off spending at $720 per resident in 2025, roughly 2.7 times the national average of $269, according to ScratchSmarter's per capita spending data. Massachusetts has one of the densest lottery retail networks in the country and one of the most aggressively structured scratch-off catalogs, with $30 games returning 84% payout rates that keep players engaged.
The one notable outlier is New Mexico, which still relies on draw games for a larger slice of its revenue than most states, reflecting a player base with a stronger preference for jackpot-style games. But New Mexico is an exception. Virtually every other major state tilts heavily toward scratch-offs.
The Jackpot Effect: When Draw Games Spike
The one scenario that reliably shifts the balance toward draw games is a billion-dollar jackpot. When Powerball or Mega Millions climbs above $800 million, casual players who never touch lottery tickets suddenly start buying. Ticket sales accelerate with each rollover, and draw game revenue spikes dramatically for the weeks that the jackpot builds.
Fiscal year 2024 had five separate billion-dollar jackpots between Powerball and Mega Millions, according to the Scientific Games FY2025 report. That's an unusually high concentration of massive jackpots, which is why FY2024 draw game sales were elevated. FY2025 had only one jackpot above $1 billion, and draw game sales fell 41.2% as a result.
Scratch-off sales don't move this way. They're stable. Players who buy scratch-offs weekly don't suddenly stop because a Powerball jackpot rolled over, and they don't suddenly buy more because a jackpot reached $500 million. The two player bases overlap but they're largely separate in terms of behavior. The casual once-in-a-while Powerball buyer and the regular scratch-off player are different customer profiles, even when the same person occasionally participates in both.
What Happened After Mega Millions Raised Its Price to $5
In April 2025, Mega Millions raised its ticket price from $2 to $5. According to sales data reported by Mezha citing LottoReport.com, in the period following the price change, Powerball sold approximately 2 billion tickets and generated roughly $4.1 billion in revenue, while Mega Millions sold 495 million tickets and generated about $2.5 billion. Powerball was outselling Mega Millions by roughly 4 to 1 on ticket count despite Powerball drawing only three times per week at $2 per ticket.
Players noticed the price difference. At $5 per ticket, Mega Millions asks players to spend 2.5 times more per play for a game with similar jackpot odds. The market responded by moving toward Powerball. The shift hadn't reversed as of early 2026.
Why Scratch-Offs Win on Volume
Several structural factors explain why scratch-offs consistently dominate lottery revenue regardless of what jackpots are doing.
Immediate resolution is the most cited factor. You scratch the ticket and you know immediately. No waiting until Wednesday night at 10:59 PM. The instant gratification loop is a much tighter feedback cycle than the multi-day anticipation of a draw game, and for most regular players it's more satisfying even when the prizes are smaller.
Higher win frequency is another factor. A $10 scratch-off with 1 in 3.5 overall odds gives you a win on roughly 28% of tickets. A $10 Powerball ticket (five $2 tickets) gives you a win on roughly 1 in 25 plays. Most players win something more often on scratch-offs, which keeps them coming back.
The payout rate is also better. As covered elsewhere on this blog, scratch-offs in most states return 70-84% per dollar at the $10-$30 tier. Powerball and Mega Millions return roughly 8-15% at typical jackpot sizes. For a player who thinks about expected value, scratch-offs are a structurally better deal at most jackpot levels.
Finally, the price ladder. State lotteries have successfully pushed players toward premium scratch-offs at $20, $30, and $50, which generate much higher revenue per transaction than a $2 Powerball ticket. The proliferation of higher-priced instant games is a deliberate product strategy, and it's working. According to ScratchSmarter, the national per capita scratch-off spend increased from $262 in 2024 to $269 in 2025, driven by increased adoption of these premium price points.
The New Category: Digital Instant Games
A third category is growing fast alongside physical scratch-offs and draw games: digital instant games played through state lottery apps or iLottery websites. These are online scratch-off equivalents where you tap instead of scratch, and the outcome is determined the same way as a physical game, by a random number generator rather than a physical print run.
According to the North Carolina Education Lottery's FY2025 management commentary, North Carolina's launch of digital instant games became the most successful iLottery launch in US history by player acquisition. Digital instants attracted new players who had never played traditional lottery games, expanding the overall base rather than cannibalizing physical scratch-off sales, and contributed nearly 40% of the lottery's overall performance growth in FY2025.
States with active iLottery programs including Michigan, Pennsylvania, Georgia, and Virginia are seeing digital instant game sales grow as a share of overall lottery revenue. The format combines the immediate resolution of scratch-offs with the convenience of playing from anywhere, and it's pulling in younger players who don't typically stop at gas stations to buy physical tickets.
Digital instant games pay out at higher rates than draw games but similar rates to physical scratch-offs, consistent with the structural reasons scratch-offs dominate in the first place. The growth of digital instants is likely to further increase the overall share of instant-win format (physical plus digital) relative to draw games in the years ahead.
What Draw Games Do That Scratch-Offs Can't
Scratch-offs can't offer a $500 million jackpot. The ceiling on a scratch-off top prize in most states is $5-$30 million, with a few outliers. Powerball and Mega Millions generate a type of cultural moment during billion-dollar jackpot runs that no scratch-off can match. The "what would you do with $1.2 billion" conversation doesn't happen around a $30 scratch-off game.
Draw games also create a different kind of engagement. The multi-day period between buying a ticket and learning the result is part of the product. Some players genuinely value that extended window of possibility. It's a different experience than the 30-second scratch-off cycle, and for certain players it's the preferable one.
The Powerball page and Mega Millions page on ScratchCheck cover current jackpots, past results, number frequency, and the Powerball random number generator or Mega Millions random number generator if you play both formats. For scratch-off rankings in your state, the state pages show which games currently have the best odds, highest payout rates, and most prizes remaining. Both formats have their place. Scratch-offs just have a much bigger place, by dollars, by players, and by growth trend.
Frequently Asked Questions
Do scratch-offs make more money than Powerball and Mega Millions?
Yes, scratch-offs generate far more lottery revenue than Powerball and Mega Millions in most states, usually accounting for roughly 65% to 75% of total lottery revenue.
Why do scratch-offs dominate lottery sales?
Scratch-offs dominate because they offer instant results, more frequent small wins, higher payout rates, and premium ticket prices that generate more revenue per transaction.
Why did lottery sales fall in fiscal year 2025?
US lottery sales fell in FY2025 mainly because draw game sales dropped after fewer billion-dollar jackpots, while scratch-off sales stayed stable.

Jessie Jurado is a news writer who covers new scratch-off launches, state lottery guides, taxes on winnings, news, and much more. She joined ScratchCheck in 2026 and writes the site's state-by-state coverage.