
Oklahoma · Best ValueScore™ Scratch-Offs
Last updated October 19, 2026
Oklahoma's #1 scratch-off right now is $5 Million Jackpot with a ValueScore™ of 99/100. ValueScore™ combines expected value, prize quality, win frequency, and inventory health into a single 0 to 100 rating, updated daily.
Printed odds are set the day a game ships and never change, but the game itself does. Every week tickets sell and prizes get claimed, and the ticket can't tell you any of that. ValueScore™ re-scores every Oklahoma game from live prize data, so it knows when the top prizes are already gone from a game that still advertises great odds, and when a quiet game is sitting on all of its big prizes. Higher is better; details below the table.
| Rank | Game | Price | ValueScore™ | Overall Odds | Top Prize |
|---|---|---|---|---|---|
| 1 | 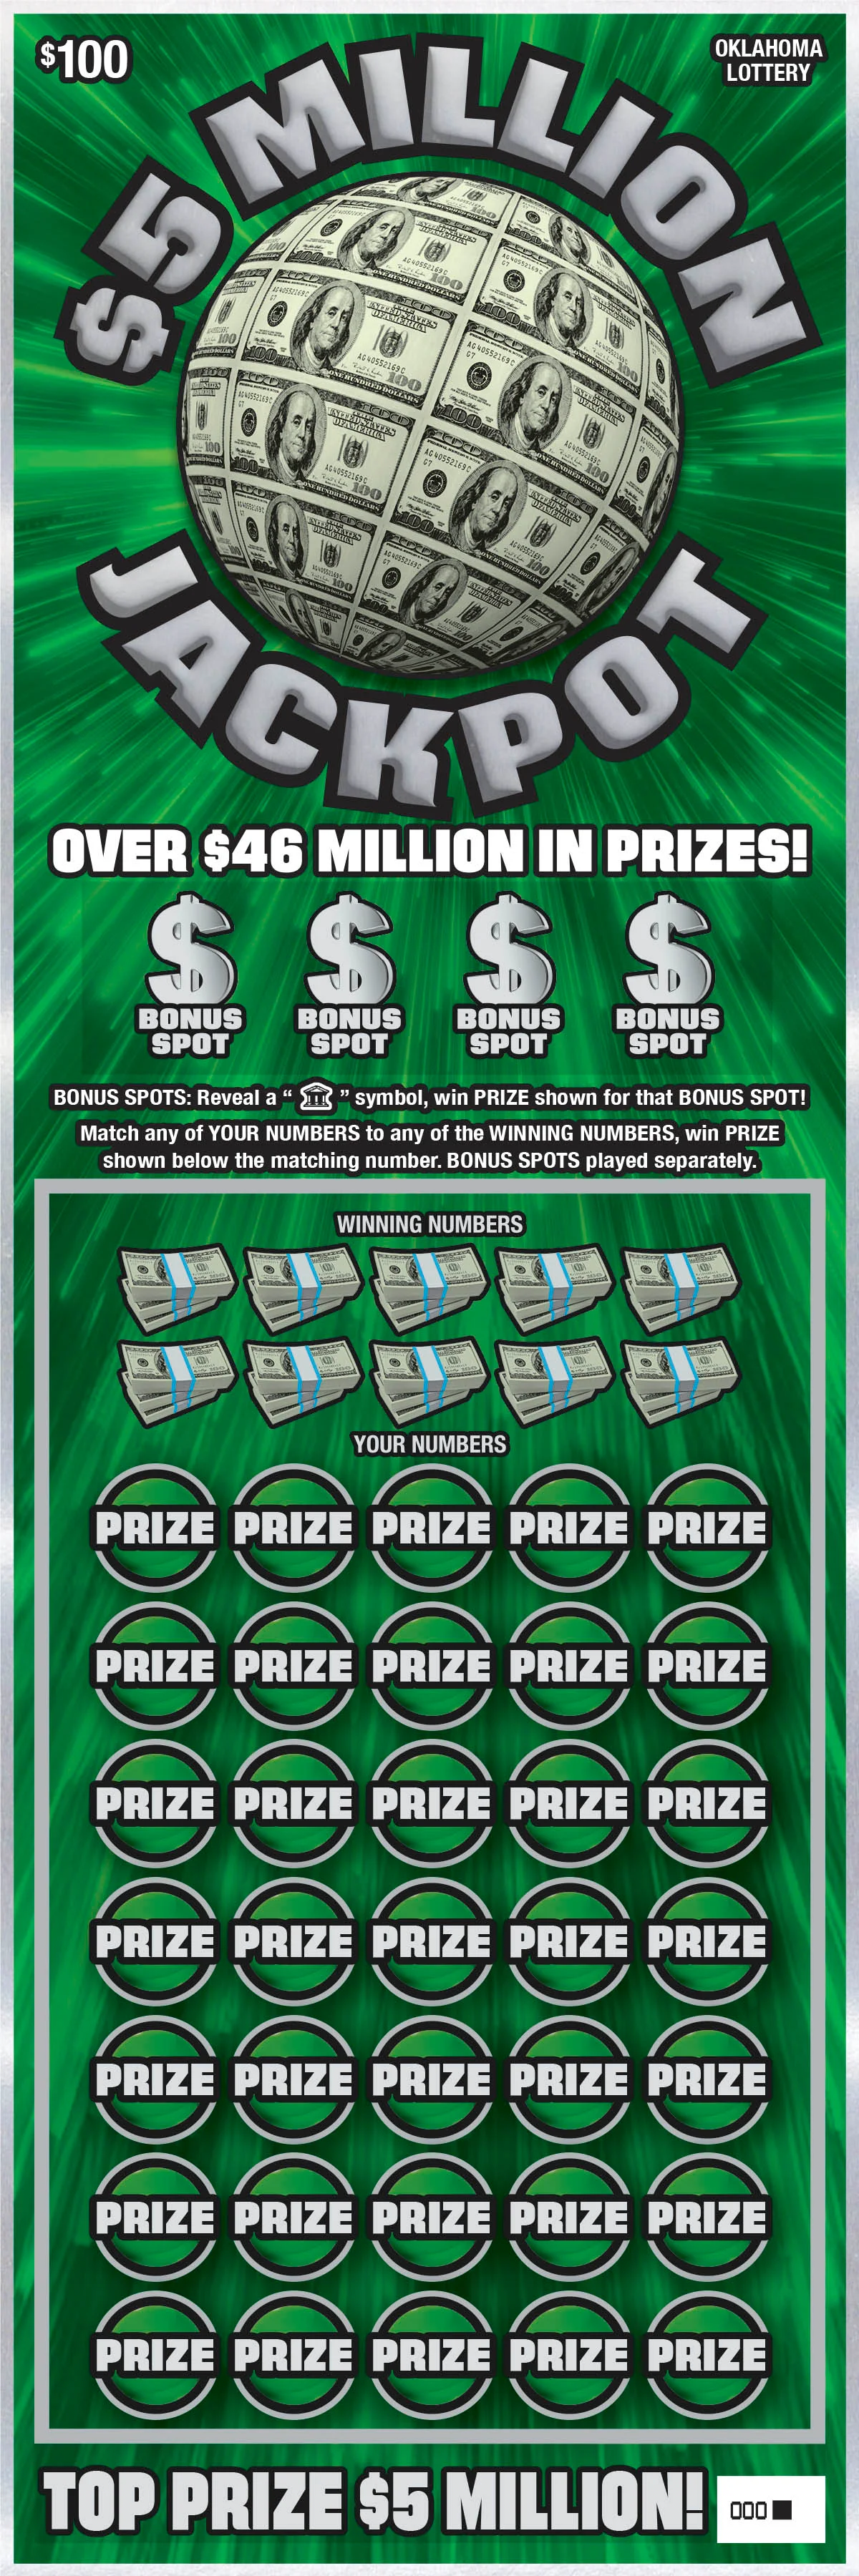 $5 Million Jackpot | $100 | 99 | 1 in 2.37 | $5,000,000 |
| 2 | 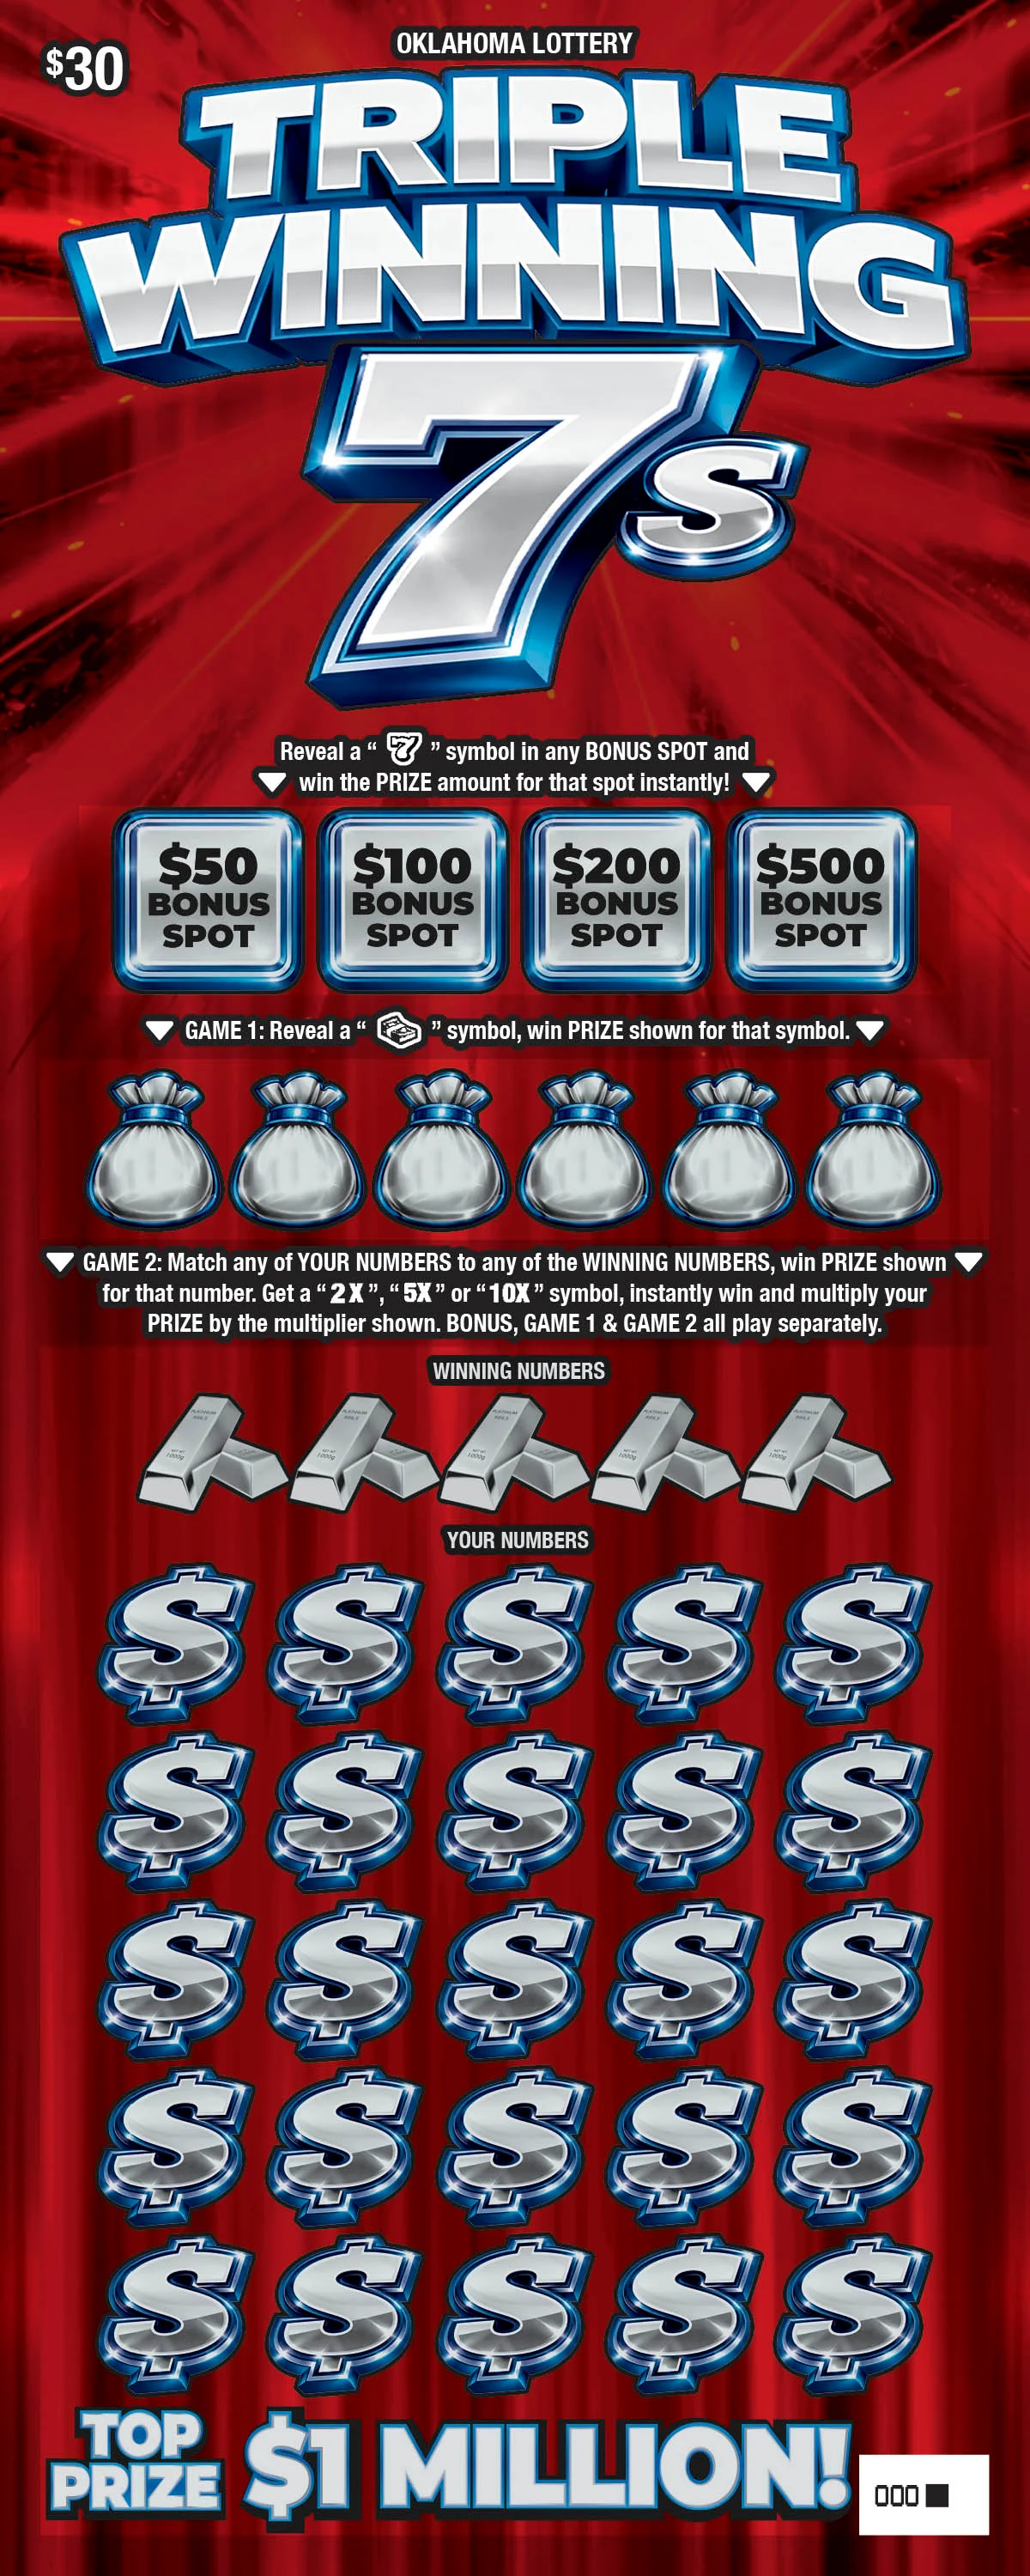 Triple Winning 7s | $30 | 94 | 1 in 2.77 | $1,000,000 |
| 3 |  Win Big | $50 | 86 | 1 in 2.93 | $3,000,000 |
| 4 | 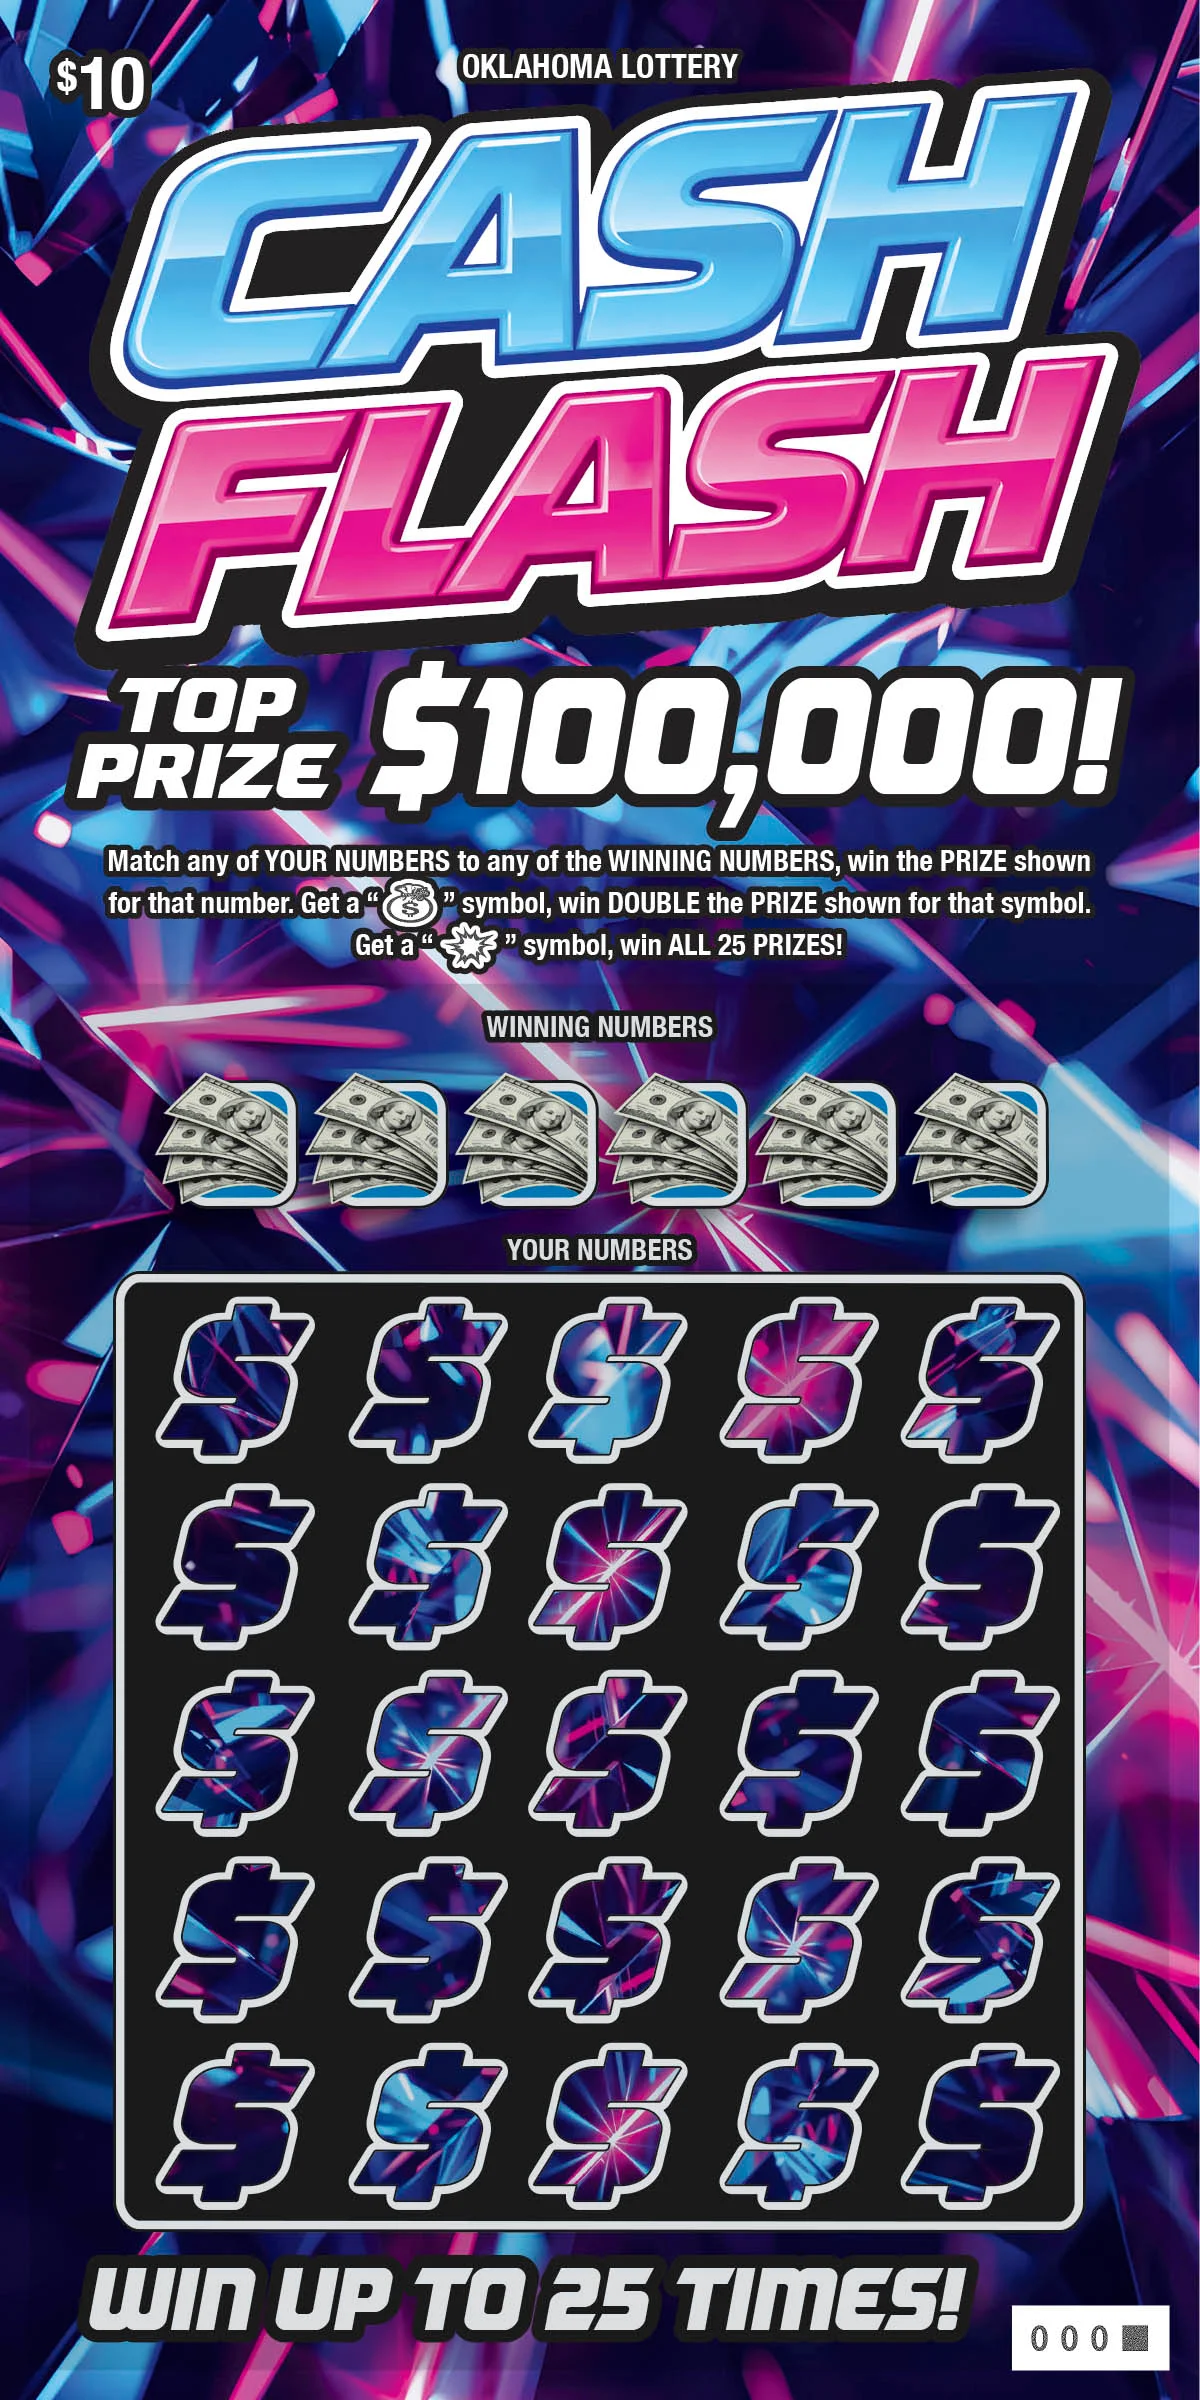 Cash Flash | $10 | 86 | 1 in 2.82 | $100,000 |
| 5 |  Million Dollar Payday | $30 | 84 | 1 in 2.64 | $1,000,000 |
| 6 |  Color Blast Bingo | $10 | 83 | 1 in 2.8 | $100,000 |
| 7 |  All the Luck | $20 | 82 | 1 in 3 | $200,000 |
| 8 | 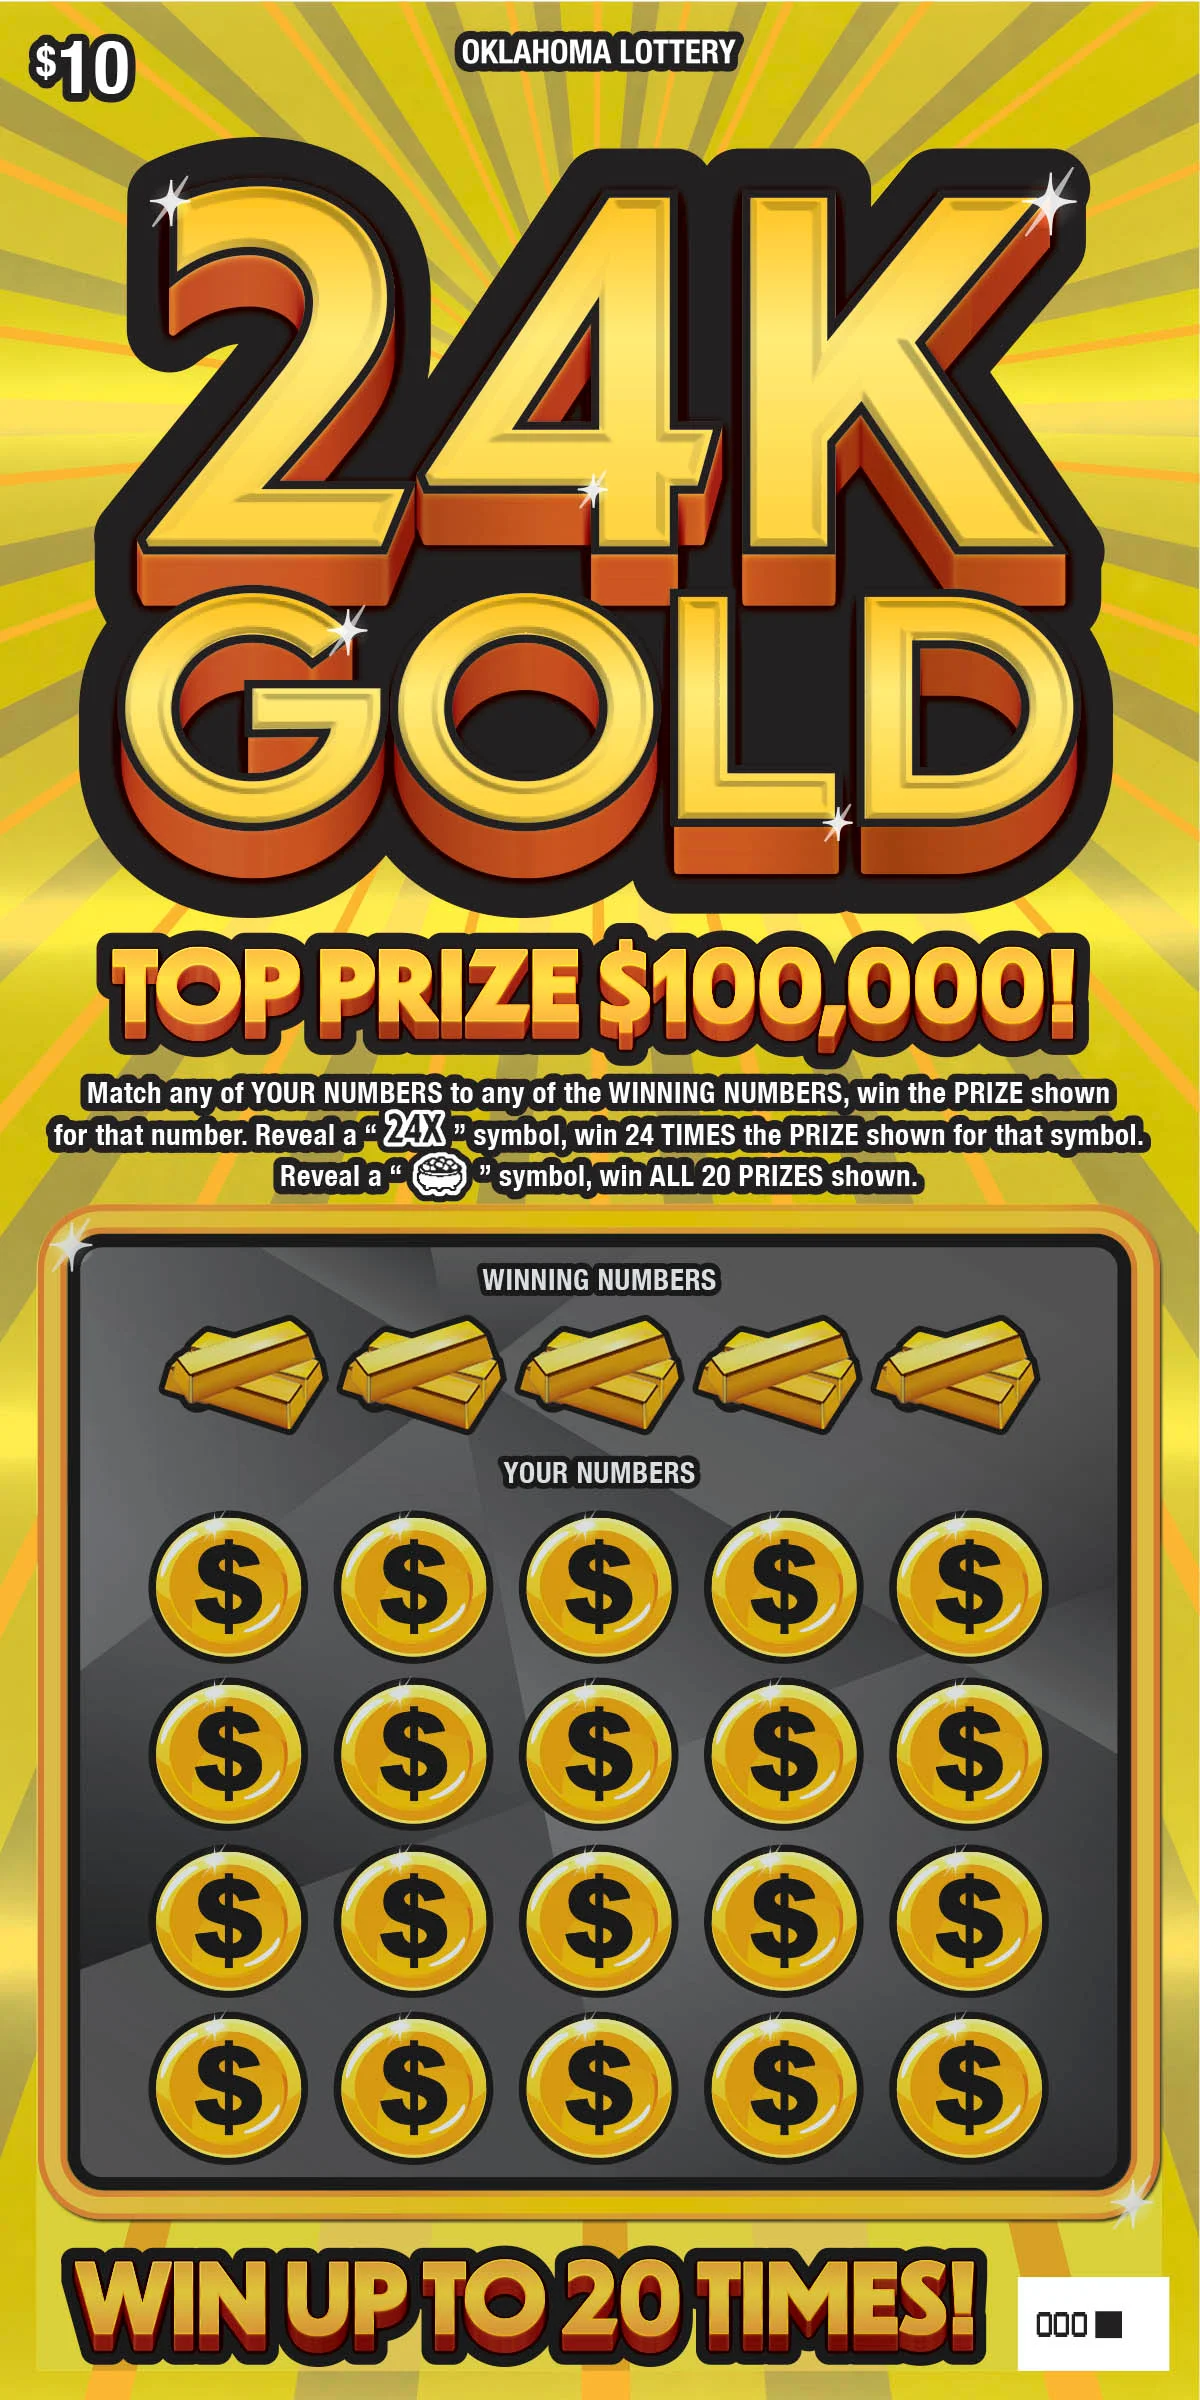 24K Gold | $10 | 81 | 1 in 2.81 | $100,000 |
| 9 | 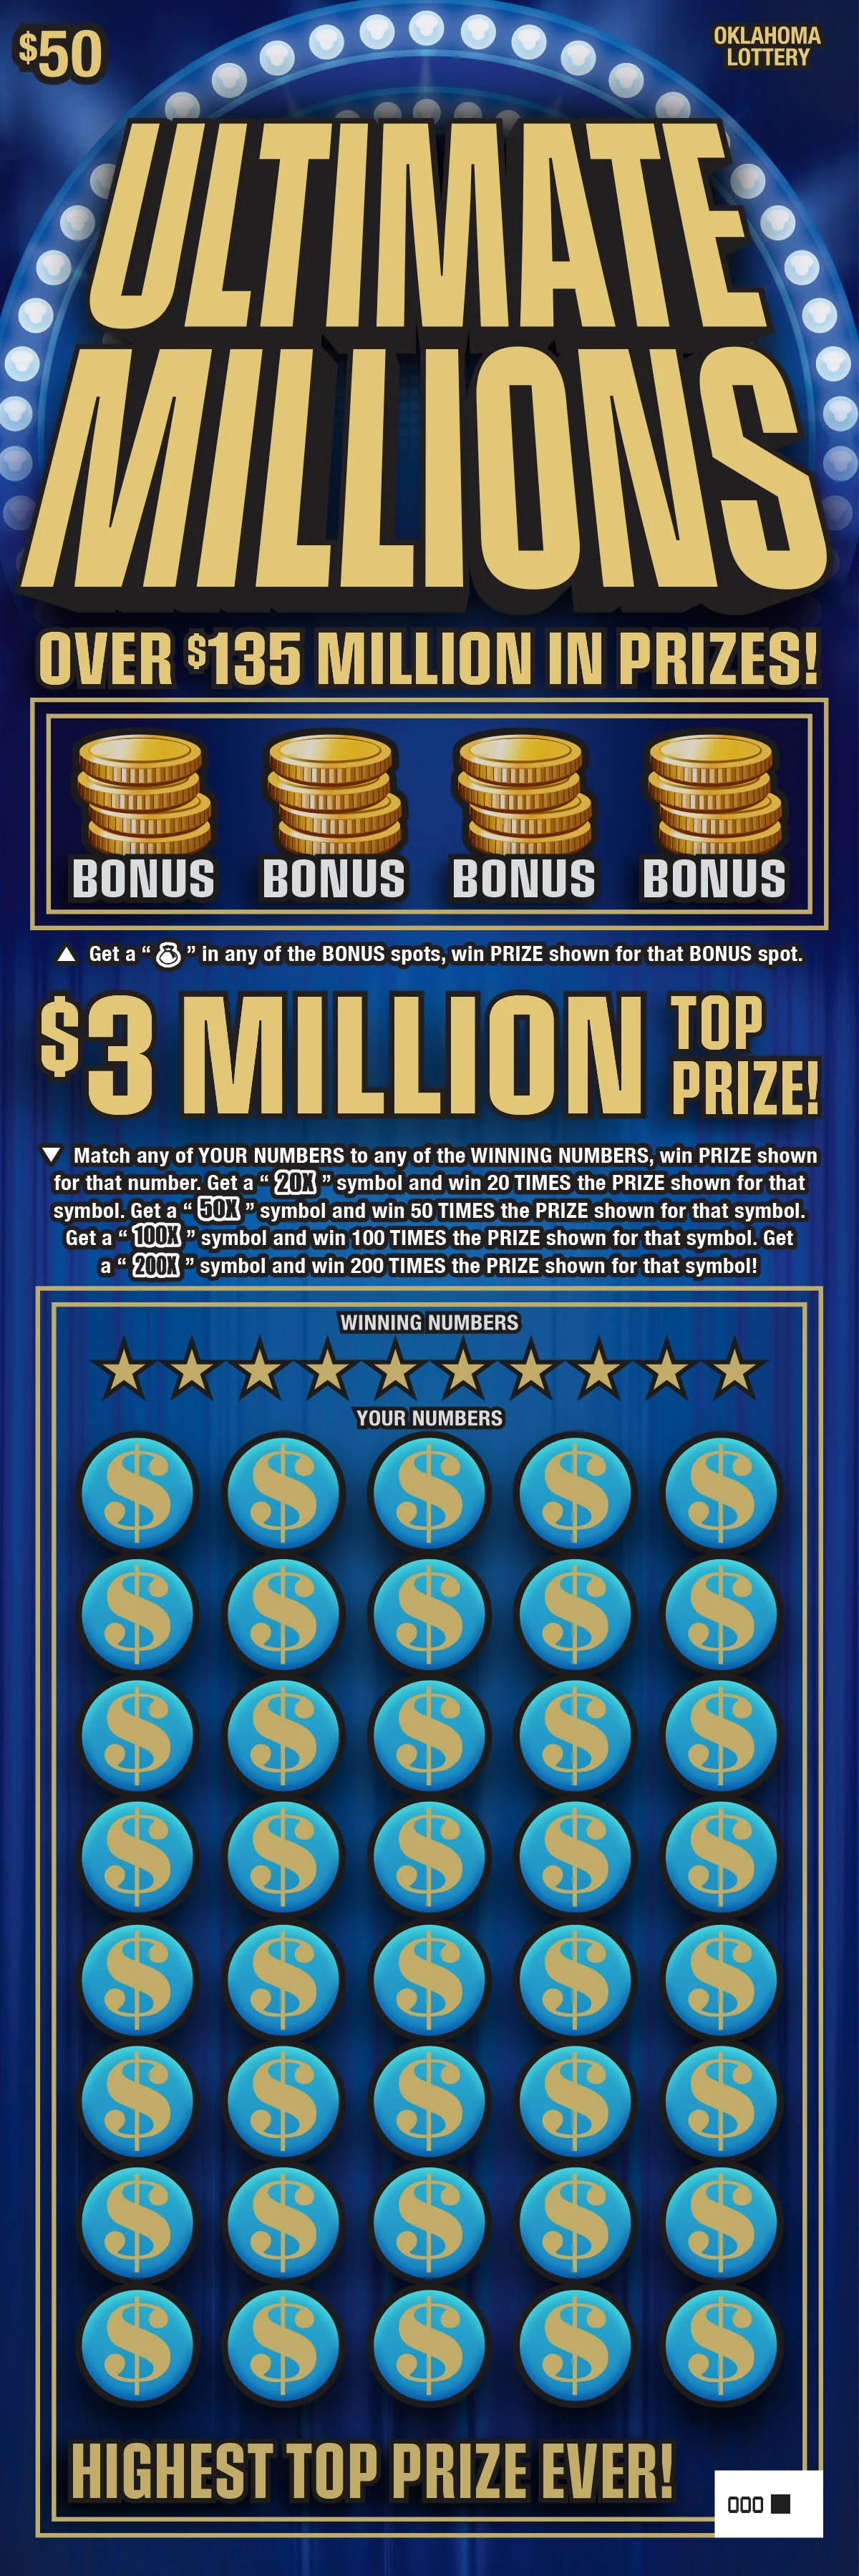 Ultimate Millions | $50 | 80 | 1 in 2.6 | $3,000,000 |
| 10 |  Wild Double Crossword | $10 | 75 | 1 in 2.81 | $100,000 |
| 11 |  Money Maker | $30 | 70 | 1 in 2.83 | $1,000,000 |
| 12 |  Power 20s | $20 | 69 | 1 in 3.04 | $200,000 |
| 13 | 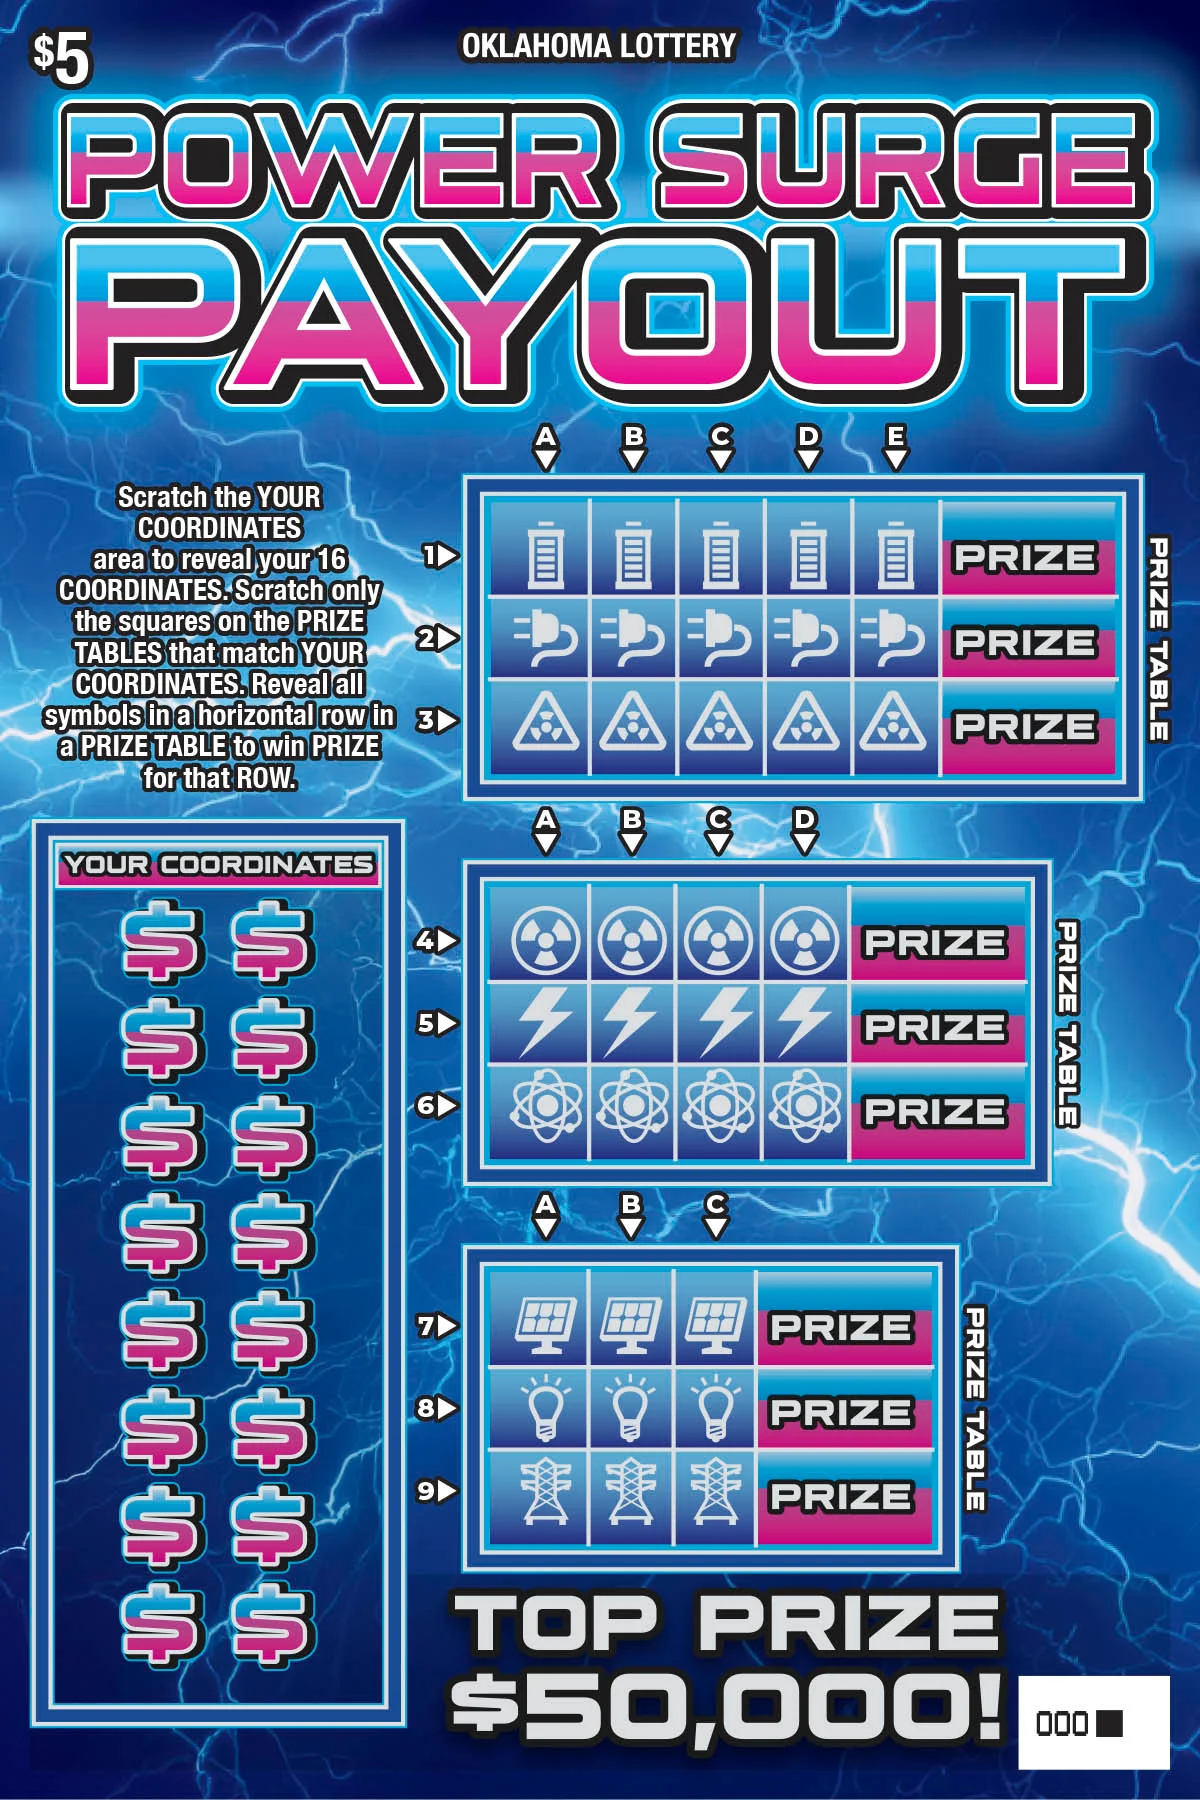 Power Surge Payout | $5 | 67 | 1 in 3.09 | $50,000 |
| 14 |  50X Wild | $10 | 67 | 1 in 2.79 | $150,000 |
| 15 | 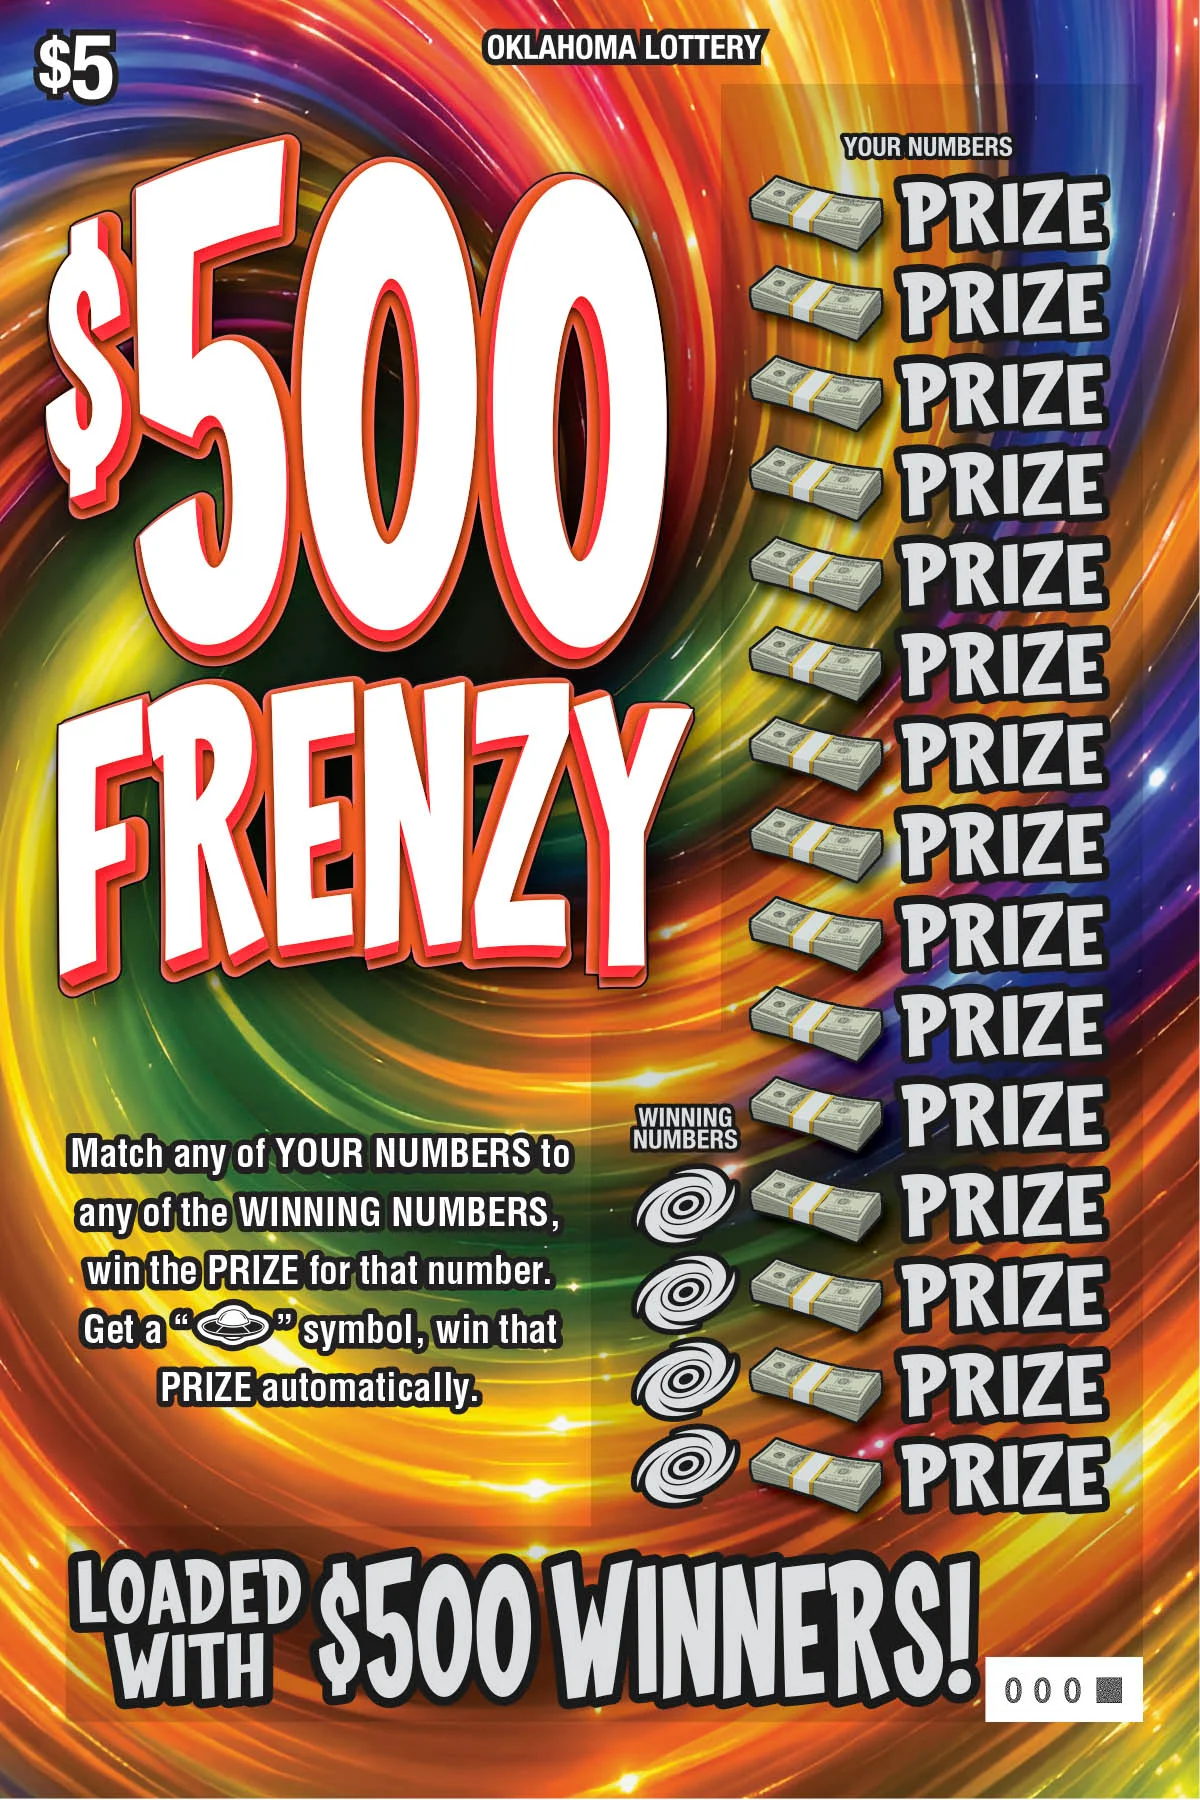 $500 Frenzy | $5 | 63 | 1 in 3.27 | $500 |
| 16 |  Cash King | $10 | 62 | 1 in 2.89 | $100,000 |
| 17 | 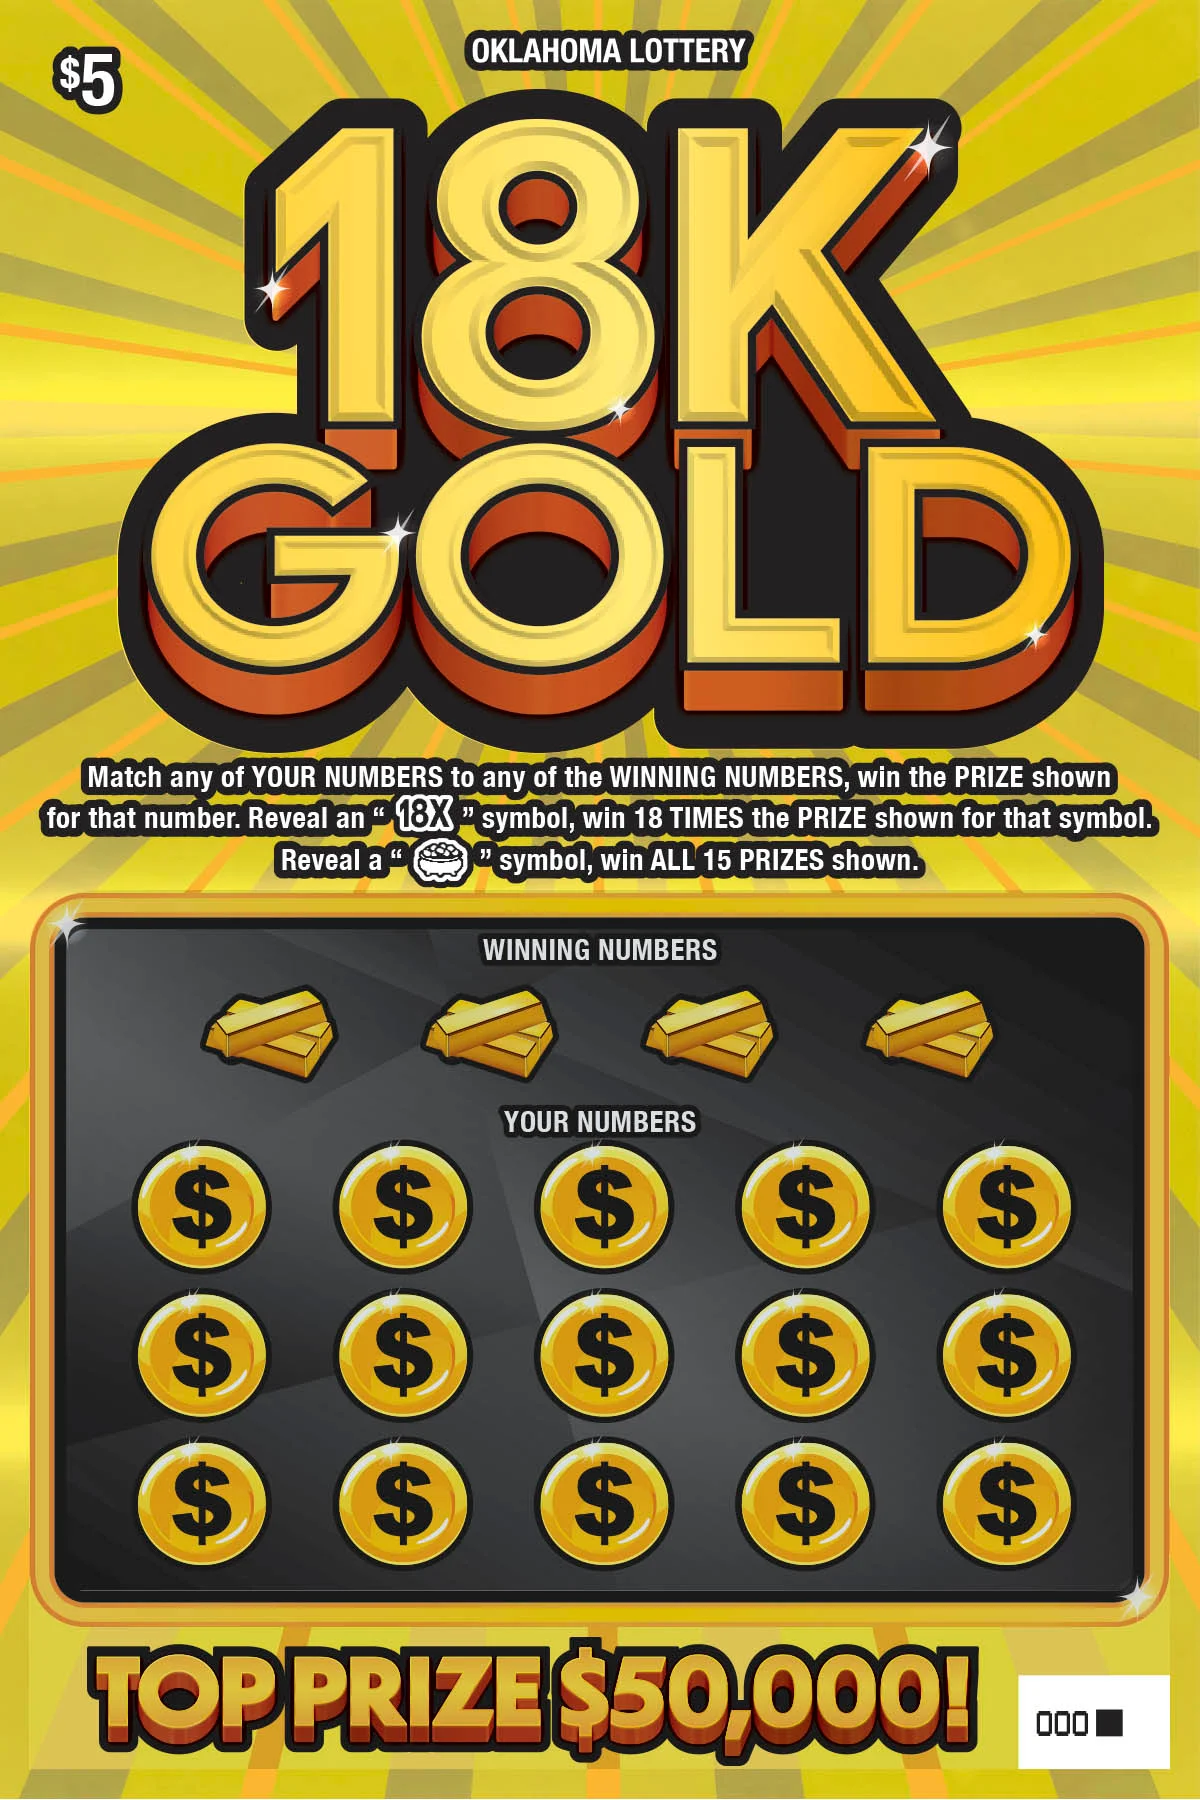 18K Gold | $5 | 62 | 1 in 3.22 | $50,000 |
| 18 |  JAWS | $10 | 61 | 1 in 3 | $100,000 |
| 19 |  Perfect 10s | $10 | 61 | 1 in 2.83 | $100,000 |
| 20 |  $2,000 Stacked | $20 | 55 | 1 in 3.15 | $2,000 |
| 21 |  Money Bag Multiplier | $5 | 54 | 1 in 3.26 | $50,000 |
| 22 |  Money Nights | $10 | 54 | 1 in 2.85 | $100,000 |
| 23 | 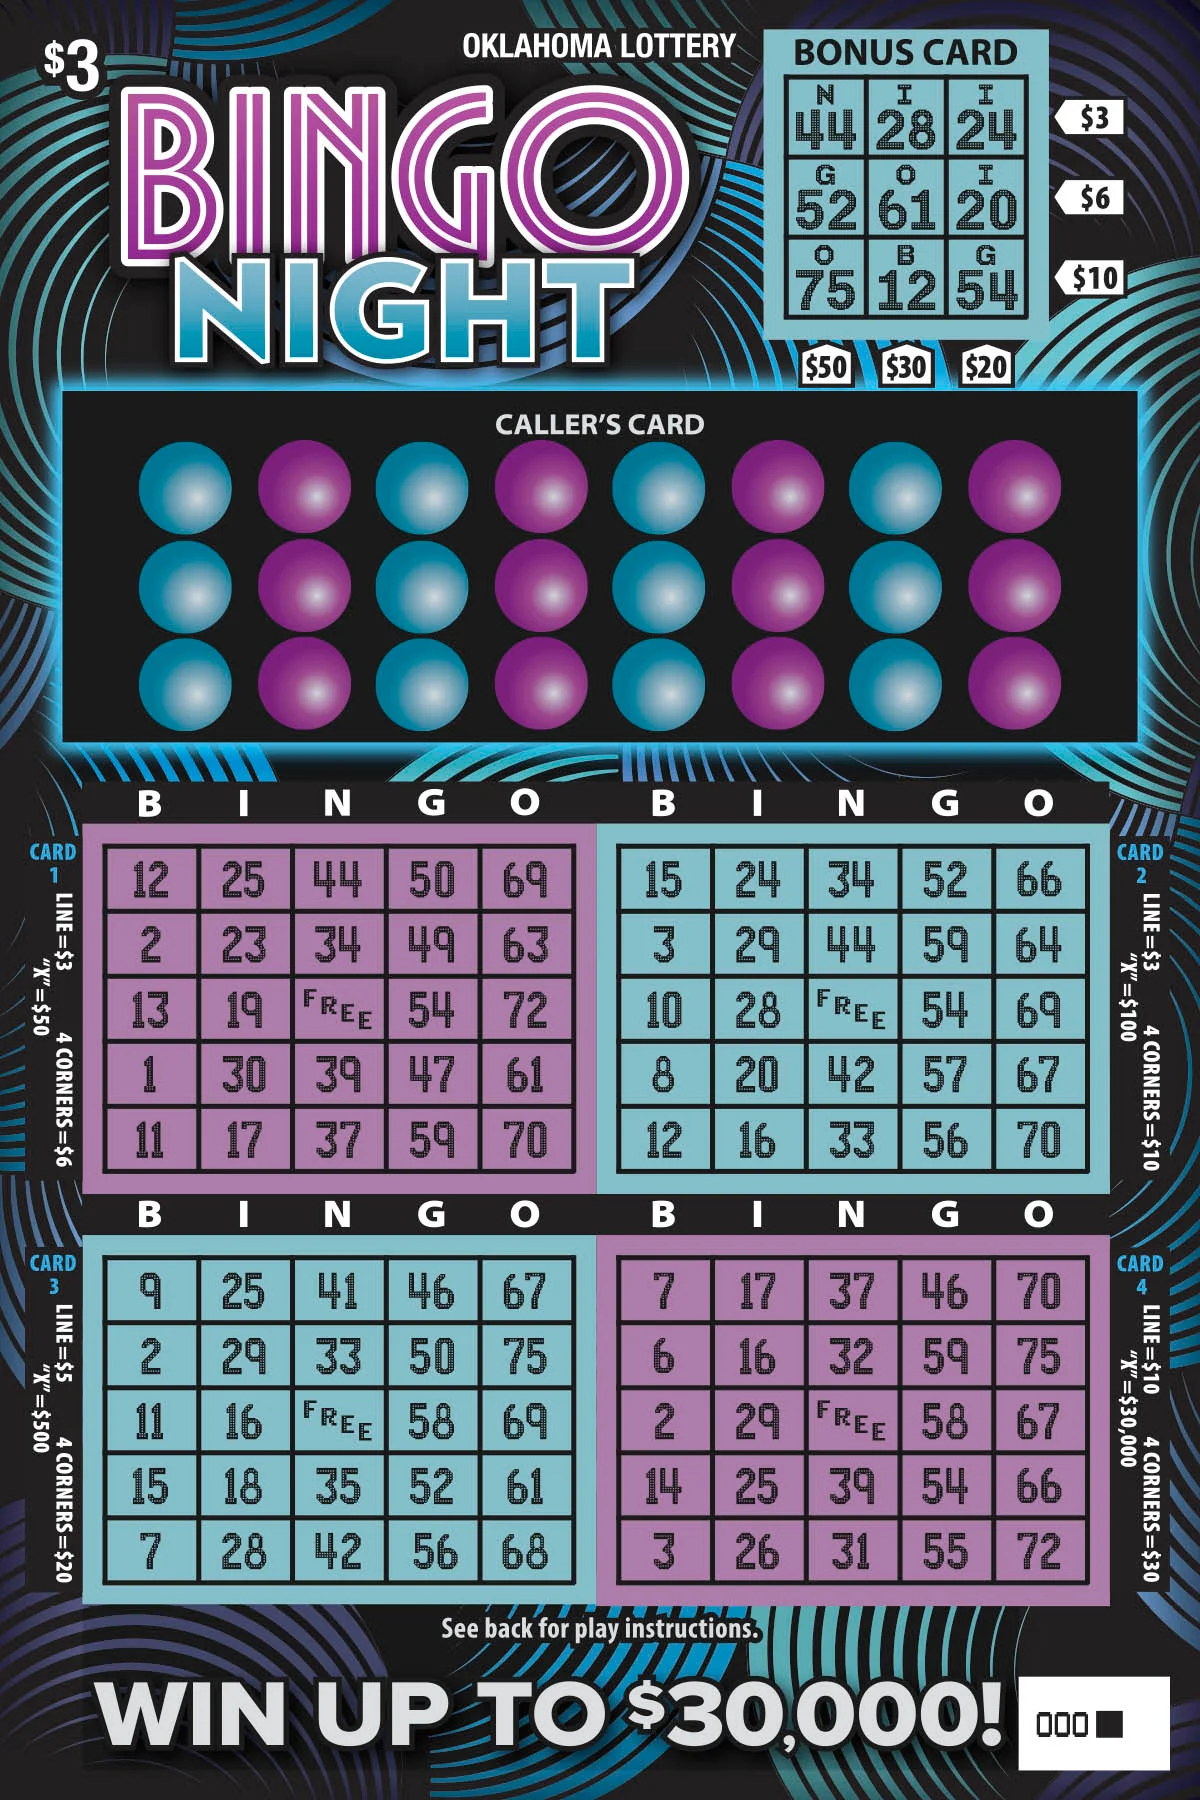 Bingo Night | $3 | 54 | 1 in 3.33 | $30,000 |
| 24 |  Crossword Extra | $3 | 54 | 1 in 3.42 | $30,000 |
| 25 |  Frogger | $5 | 51 | 1 in 3.09 | $50,000 |
| 26 |  Buried Treasure | $3 | 51 | 1 in 3.3 | $25,000 |
| 27 | 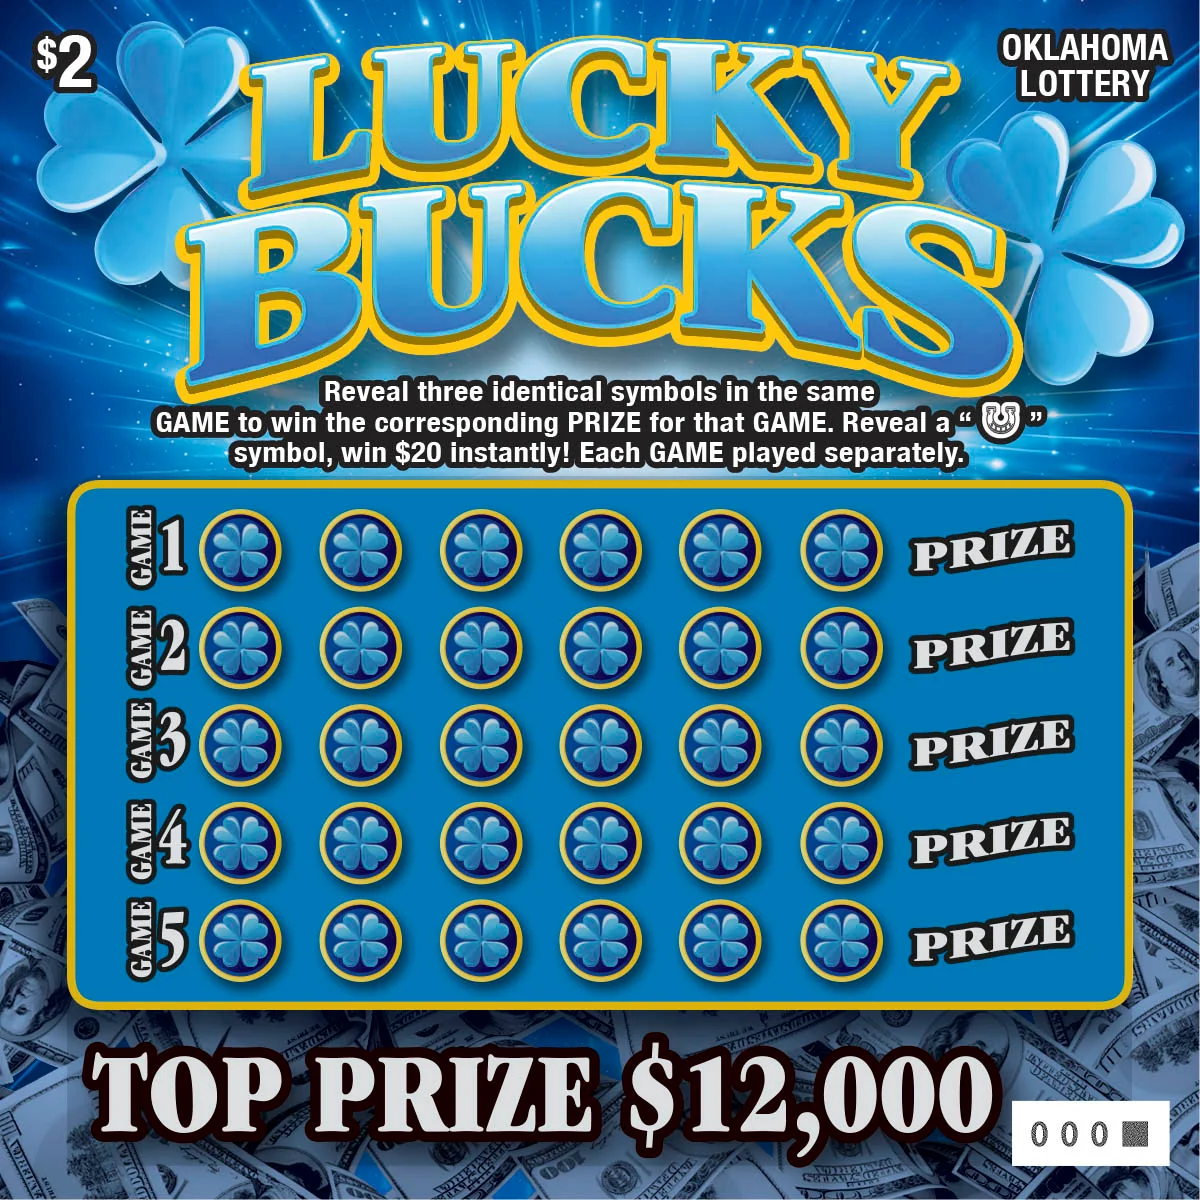 Lucky Bucks | $2 | 50 | 1 in 4.04 | $12,000 |
| 28 |  Deluxe Bucks | $5 | 49 | 1 in 3.19 | $50,000 |
| 29 |  Stroke of Luck | $10 | 47 | 1 in 3 | $125,000 |
| 30 |  7 | $5 | 47 | 1 in 3.1 | $50,000 |
| 31 |  Triple Play | $5 | 46 | 1 in 3.11 | $50,000 |
| 32 | 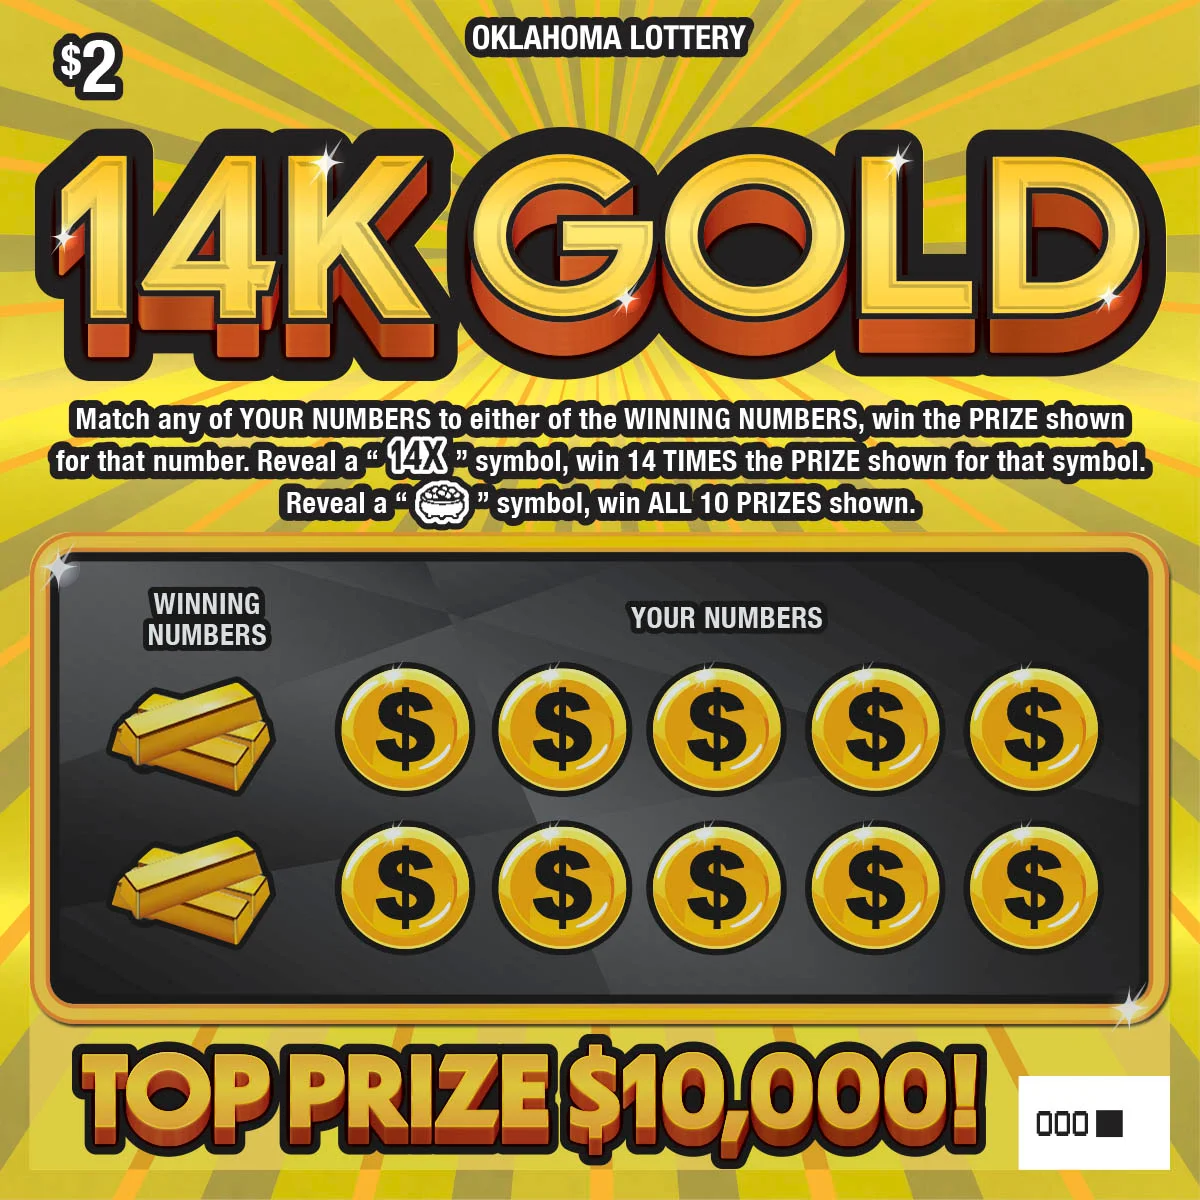 14K Gold | $2 | 46 | 1 in 4.14 | $10,000 |
| 33 | 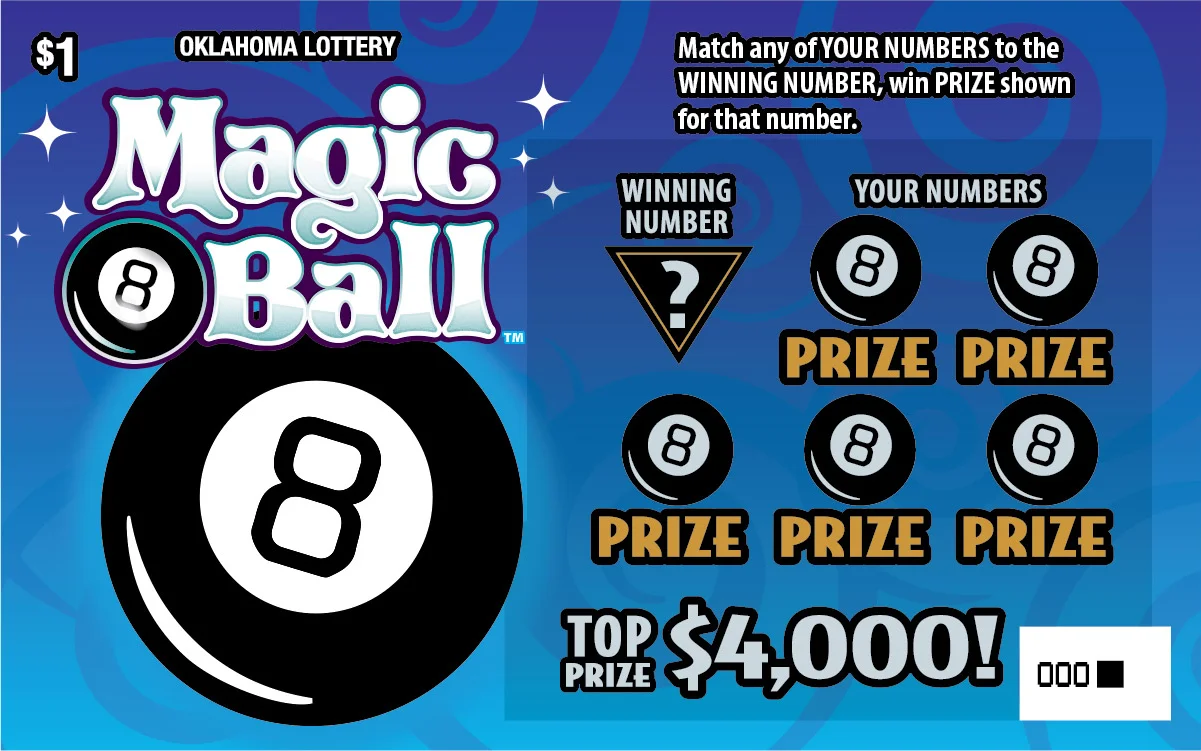 Magic 8 Ball™ | $1 | 46 | 1 in 4.03 | $4,000 |
| 34 | 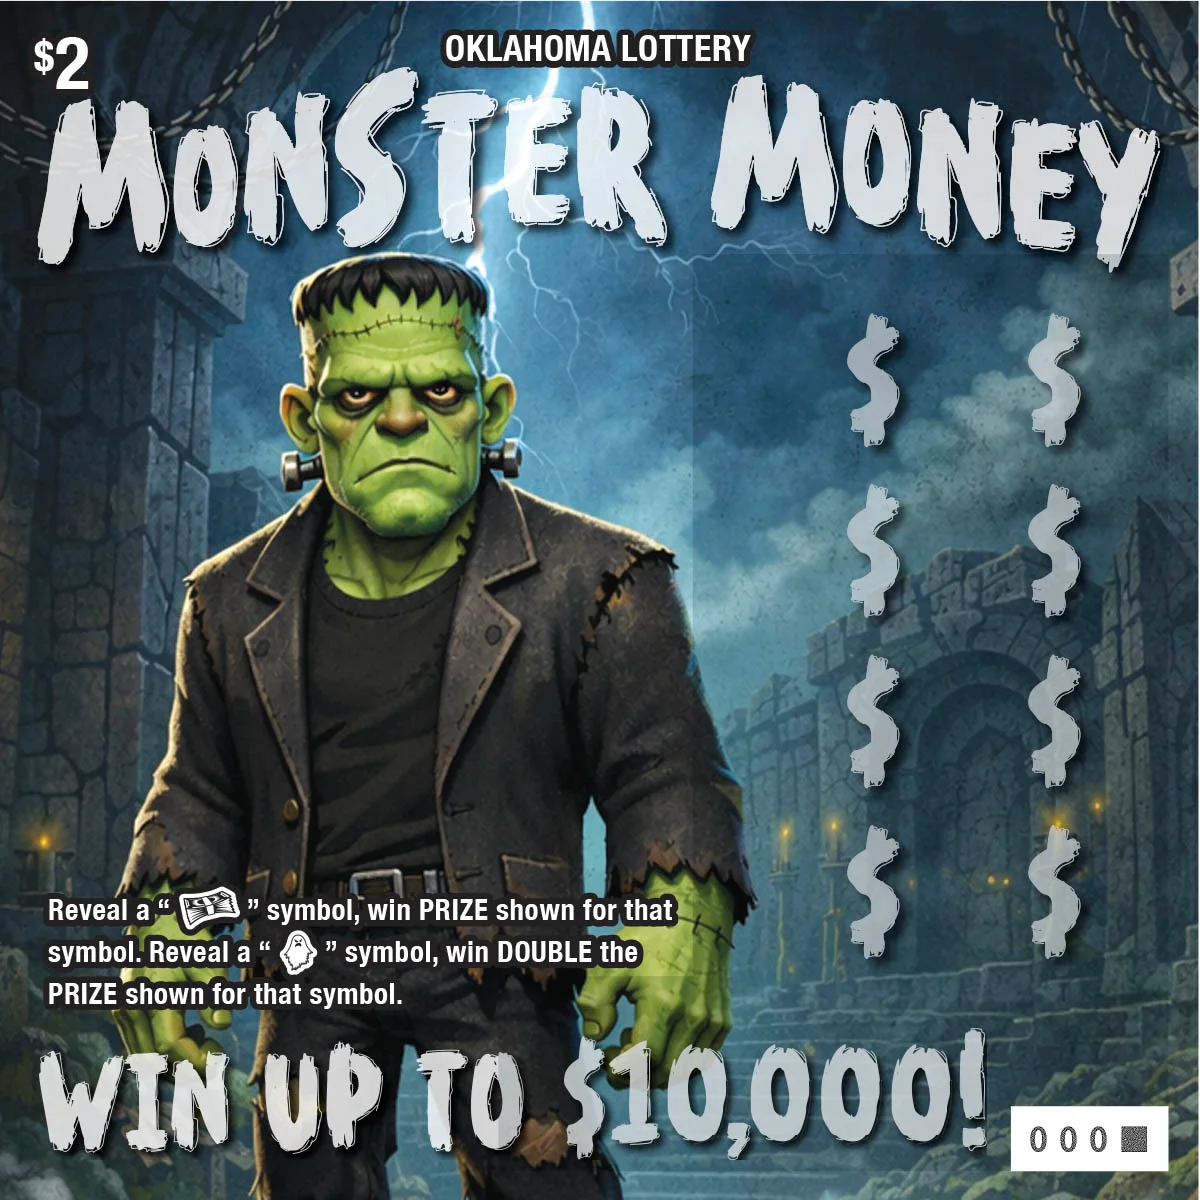 Monster Money | $2 | 45 | 1 in 4.02 | $10,000 |
| 35 |  Neon 9s | $2 | 44 | 1 in 4.1 | $19,000 |
| 36 |  Lucky Loot | $5 | 41 | 1 in 3.23 | $50,000 |
| 37 |  Mystery Crossword | $10 | 41 | 1 in 2.86 | $100,000 |
| 38 |  Money Comb | $3 | 39 | 1 in 3.17 | $25,000 |
| 39 | 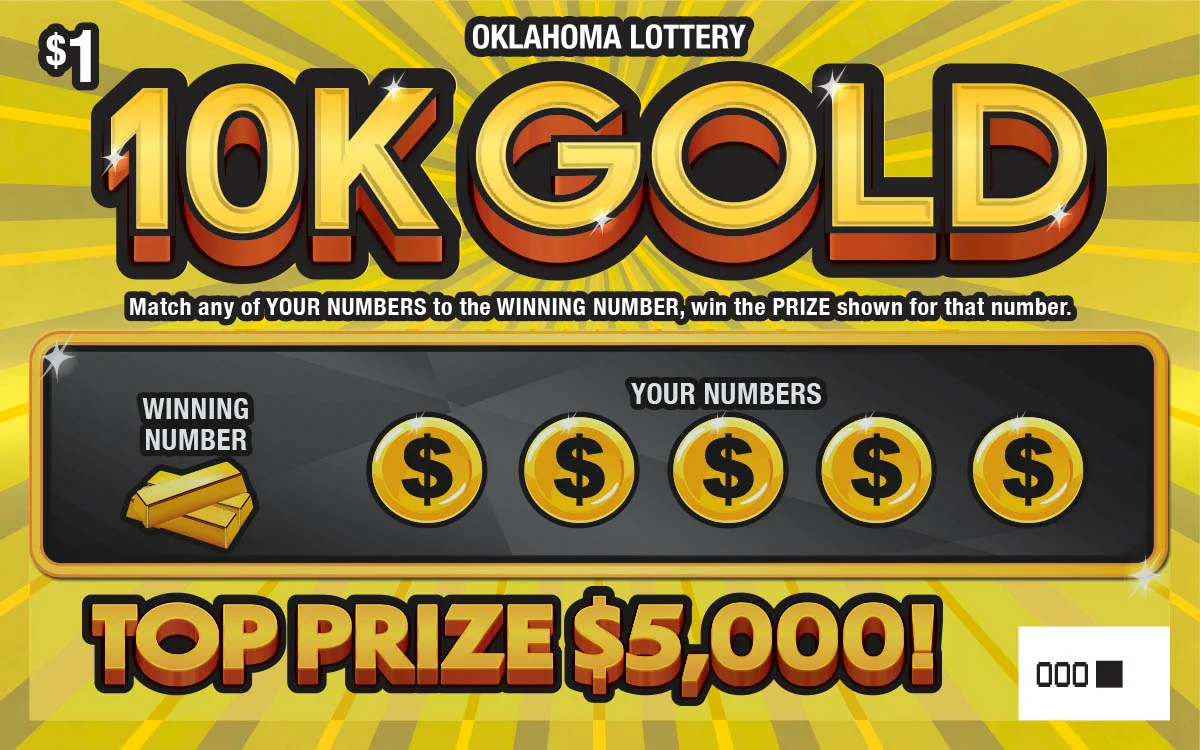 10K Gold | $1 | 37 | 1 in 4.13 | $5,000 |
| 40 |  $500 Frenzy (Game #820) | $5 | 35 | 1 in 3.25 | $500 |
| 41 |  Cash Stash | $2 | 34 | 1 in 3.9 | $12,000 |
| 42 |  Win $100 | $2 | 34 | 1 in 4.08 | $100 |
| 43 |  Match 2 Win | $1 | 34 | 1 in 4.04 | $5,000 |
| 44 |  Diamond Dollars | $5 | 33 | 1 in 3.21 | $55,000 |
| 45 |  Bingo | $3 | 25 | 1 in 3.28 | $30,000 |
| 46 |  3-2-WON | $1 | 24 | 1 in 4.05 | $4,000 |
| 47 |  Crossword | $3 | 21 | 1 in 3.67 | $30,000 |
| 48 |  Lucky Duck | $1 | 19 | 1 in 4.09 | $4,000 |
| 49 |  PAC-MAN | $2 | 16 | 1 in 4.13 | $10,000 |
| 50 |  Money Multiplier | $1 | 6 | 1 in 4.32 | $5,000 |
How ValueScore is built
Most people judge a scratch off by two numbers: the overall odds printed on the ticket, and maybe how many prizes are left. Both are easy to read, and both mislead on their own. Overall odds only tell you how often any prize hits, and most of those are break-even reprints. A ticket can advertise 1 in 3 and still be a bad buy once the prizes worth winning are gone. Remaining-prize countshave the opposite blind spot: “400 prizes left” means nothing without the price, the odds, and how many of the top prizes are actually still in the pool.
ValueScore reads all of it at once and rates what those two numbers can’t see on their own. It blends the four signals that actually decide whether a ticket is worth buying, which is why our top pick in Oklahoma often looks nothing like the game with the flashiest odds:
- Expected Value (weighted most heavily). Published per-ticket return across the full prize structure, not just the headline odds.
- Prize Quality. How much of the payout sits in prizes worth winning versus tiny break-even reprints.
- Win Frequency. Your probability of any prize per ticket.
- Inventory Health. Top prizes still unclaimed versus tickets remaining. This is the one the ticket can’t show you: a game with great printed odds whose jackpots are already gone. (Exact weighting is proprietary.)
Scores recompute after every successful Oklahoma scrape, so a game listed at the top last week may have moved. See the national ValueScore ranking for cross-state context.