
Pennsylvania · Highest Prize Payout
Last updated September 23, 2026
Merry Money Match ($30) leads Pennsylvania with a 82.5% prize payout rate. Payout percentage measures how much of each dollar spent is returned as prizes across all winners.
| Rank | Game | Price | Payout % | Top Prize |
|---|---|---|---|---|
| 1 | 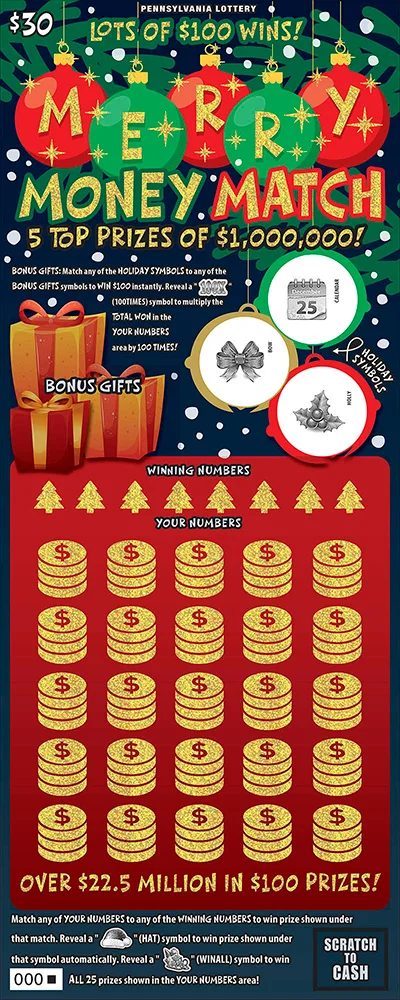 Merry Money Match Merry Money Match | $30 | 82.5% | $1,000,000 |
| 2 | 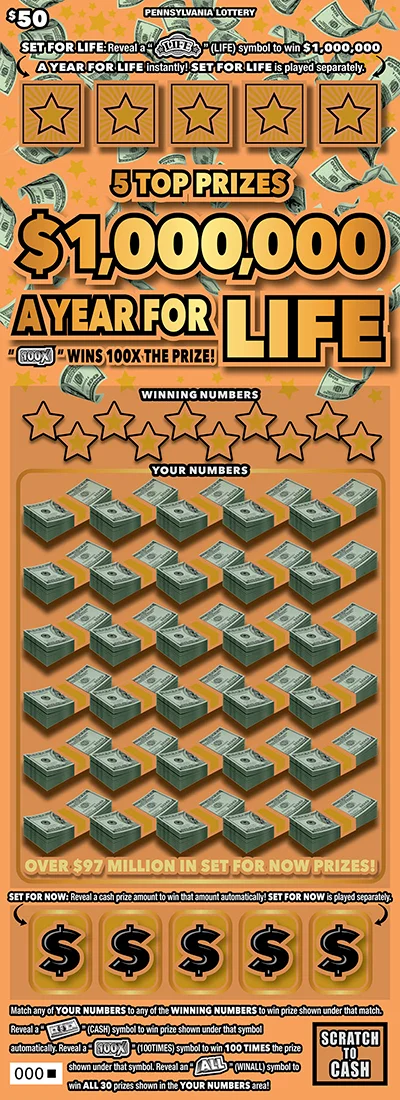 $1,000,000 a Year for Life $1,000,000 a Year for Life | $50 | 82.0% | $14,500,000 |
| 3 | 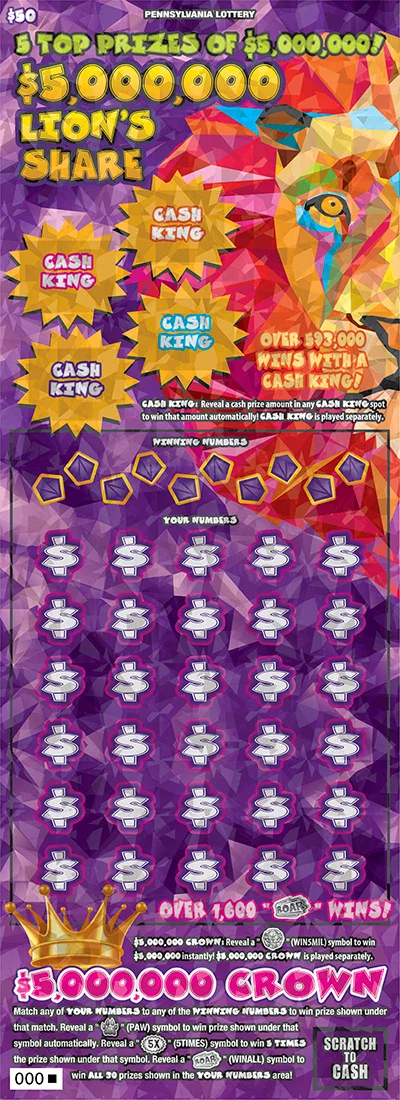 $5,000,000 Lion’s Share $5,000,000 Lion’s Share | $50 | 80.1% | $5,000,000 |
| 4 | 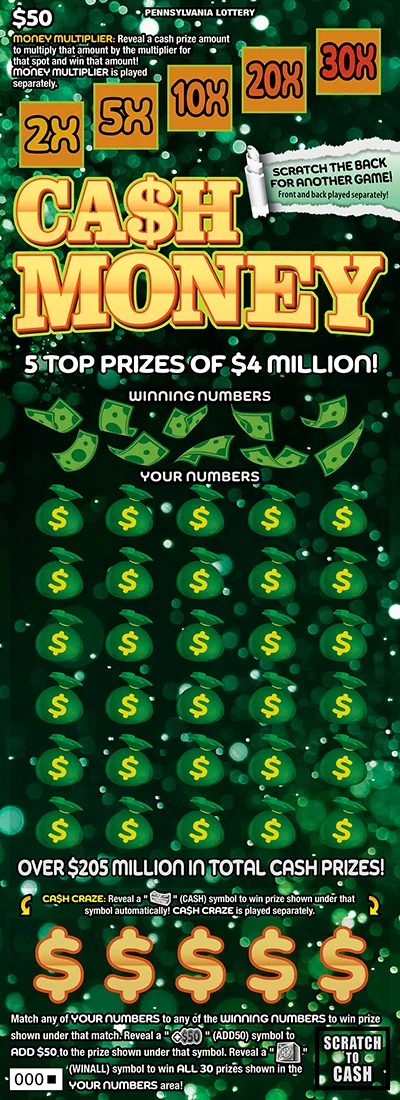 Ca$h Money Ca$h Money | $50 | 80.1% | $4,000,000 |
| 5 | 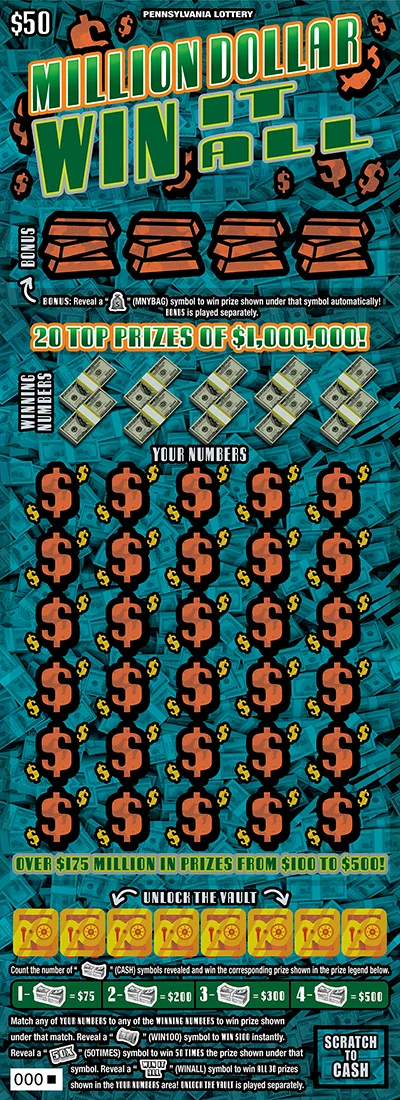 Million Dollar Win It All Million Dollar Win It All | $50 | 80.1% | $1,000,000 |
| 6 | 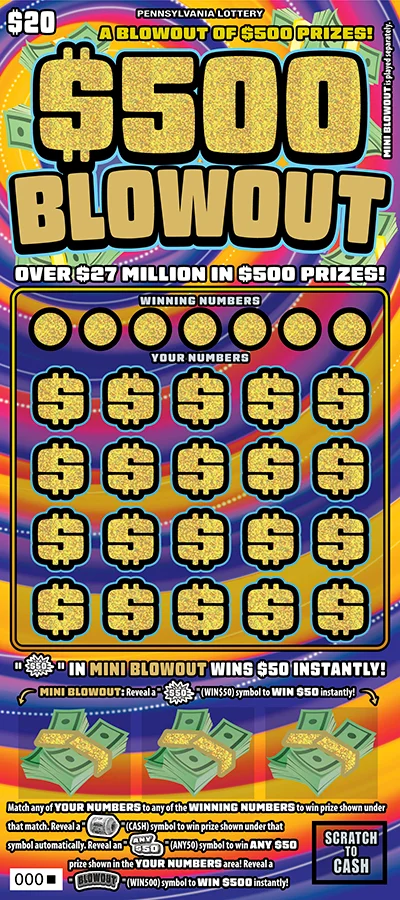 $500 Blowout $500 Blowout | $20 | 80.0% | $500 |
| 7 | 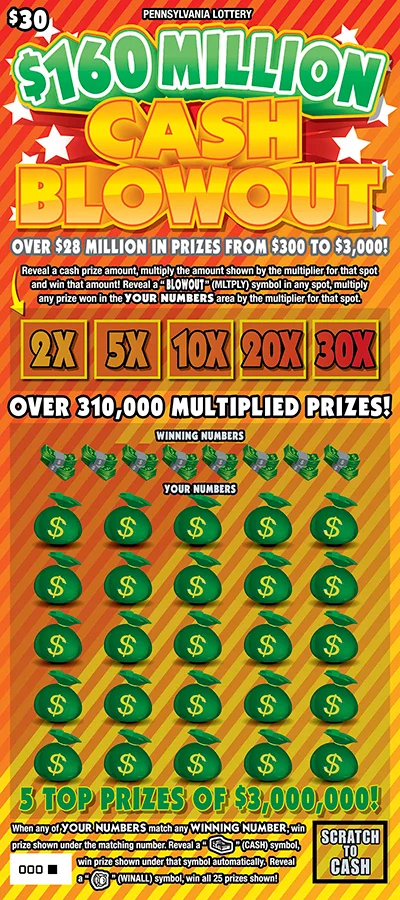 $160 Million Cash Blowout $160 Million Cash Blowout | $30 | 79.5% | $3,000,000 |
| 8 | 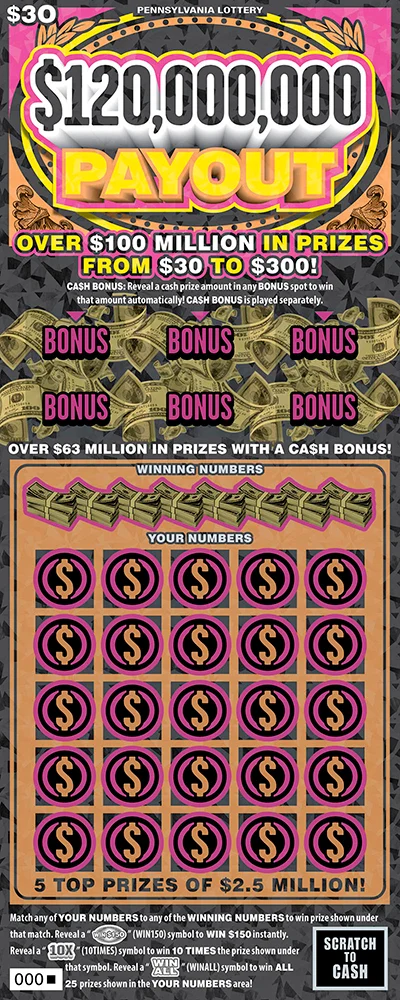 $120,000,000 Payout $120,000,000 Payout | $30 | 79.3% | $2,500,000 |
| 9 | 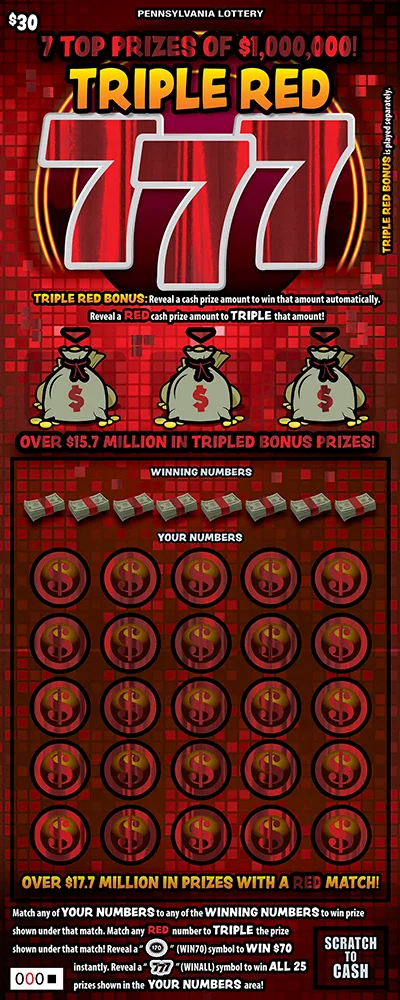 Triple Red 777 Triple Red 777 | $30 | 79.3% | $1,000,000 |
| 10 | 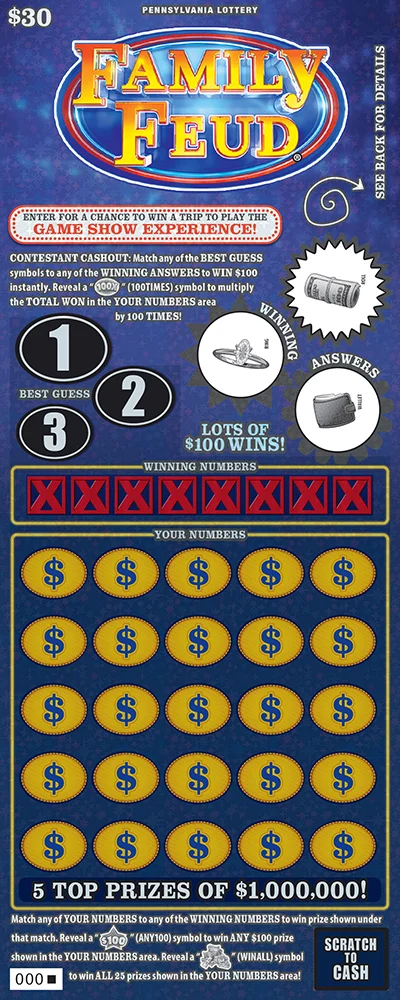 GAME SHOW EXPERIENCE GAME SHOW EXPERIENCE | $30 | 79.2% | $1,000,000 |
| 11 | 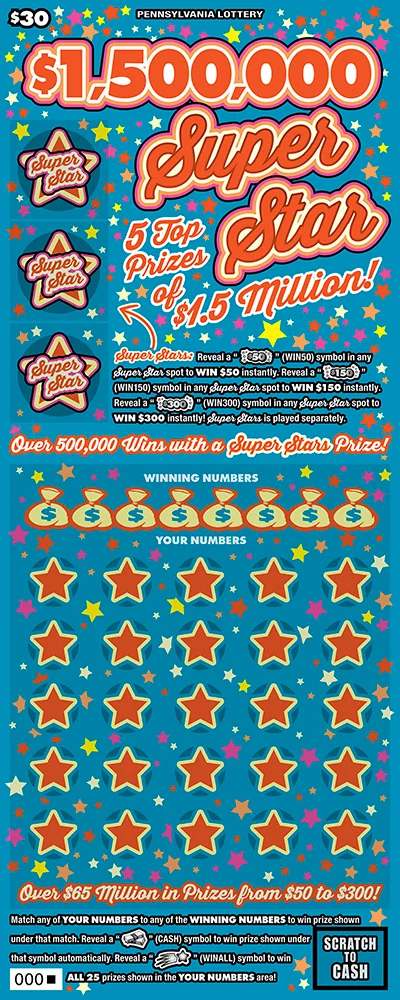 $1,500,000 Super Star $1,500,000 Super Star | $30 | 79.2% | $1,500,000 |
| 12 | 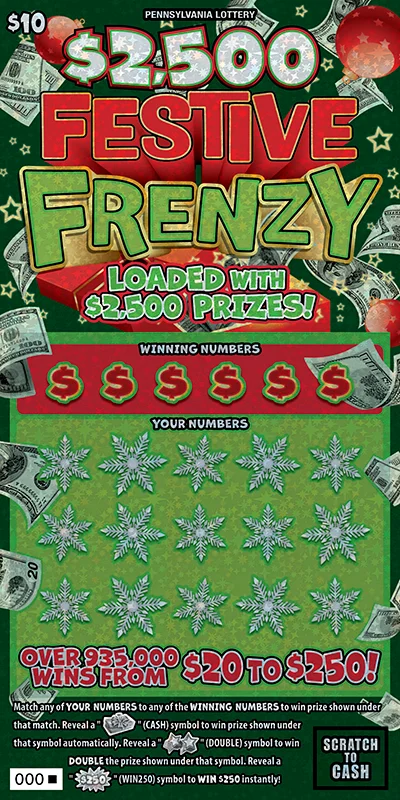 $2,500 Festive Frenzy $2,500 Festive Frenzy | $10 | 78.5% | $2,500 |
| 13 | 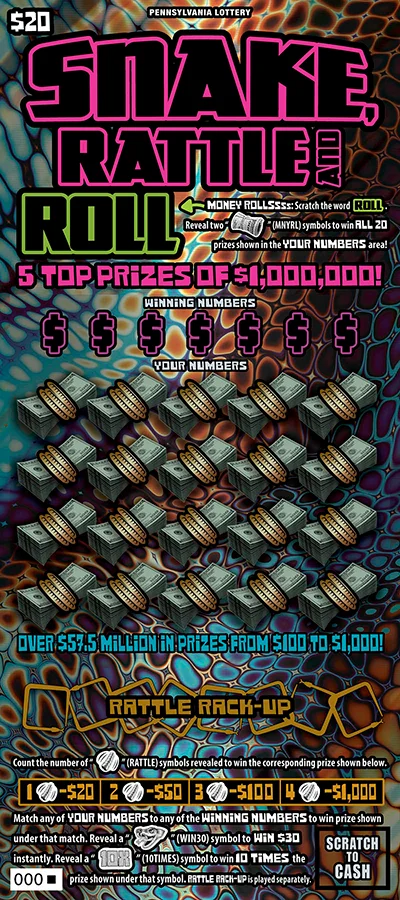 Snake, Rattle and Roll Snake, Rattle and Roll | $20 | 78.4% | $1,000,000 |
| 14 | 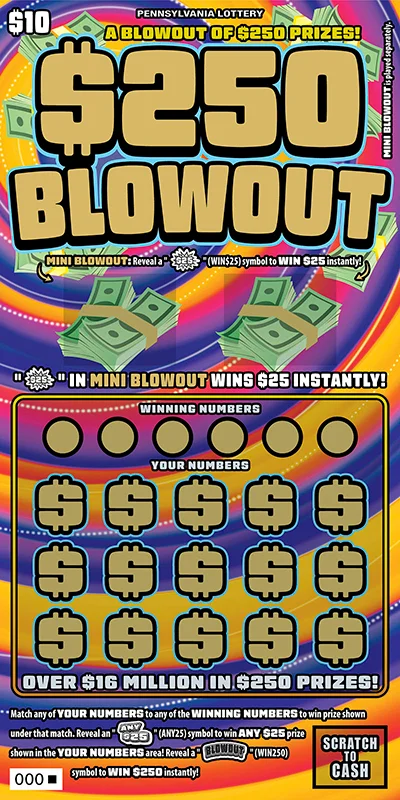 $250 Blowout $250 Blowout | $10 | 78.4% | $250 |
| 15 | 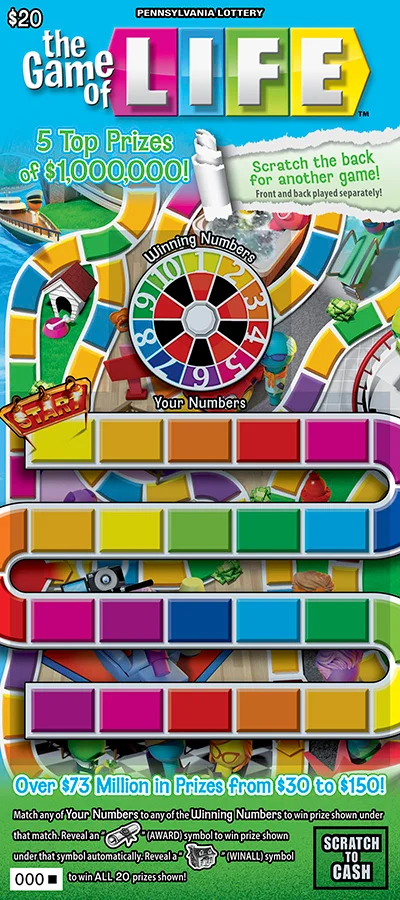 THE GAME OF LIFE THE GAME OF LIFE | $20 | 78.3% | $1,000,000 |
| 16 | 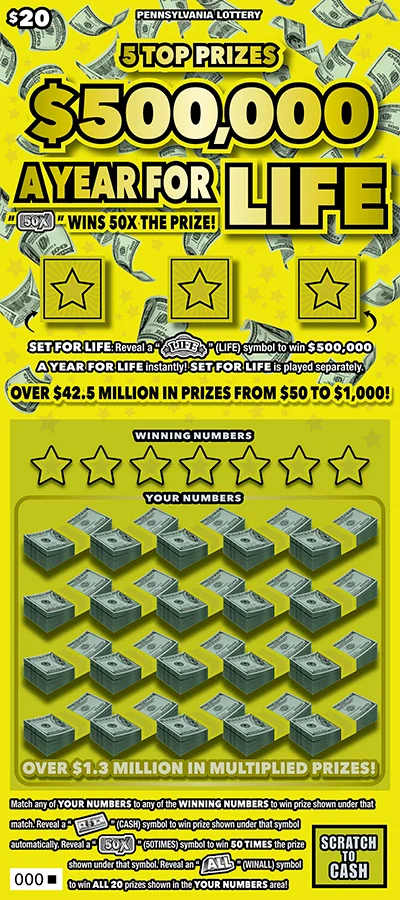 $500,000 a Year for Life $500,000 a Year for Life | $20 | 77.8% | $7,250,000 |
| 17 | 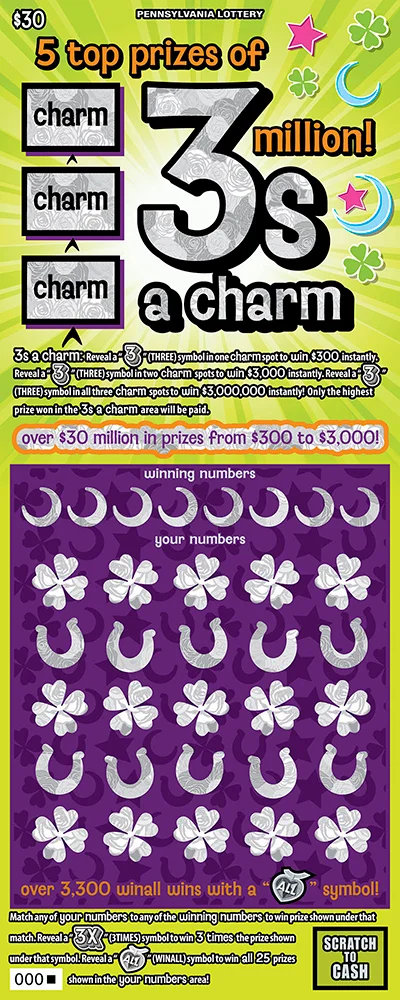 3s a Charm 3s a Charm | $30 | 77.6% | $3,000,000 |
| 18 | 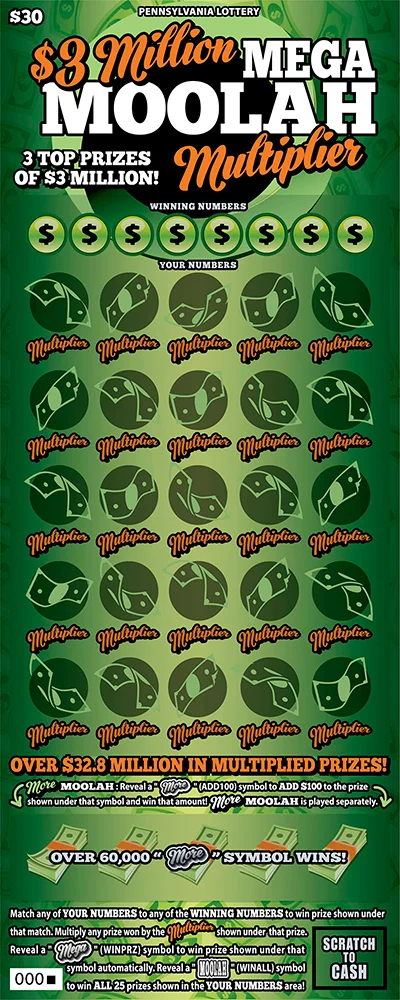 $3 Million Mega Moolah Multiplier $3 Million Mega Moolah Multiplier | $30 | 77.6% | $3,000,000 |
| 19 | 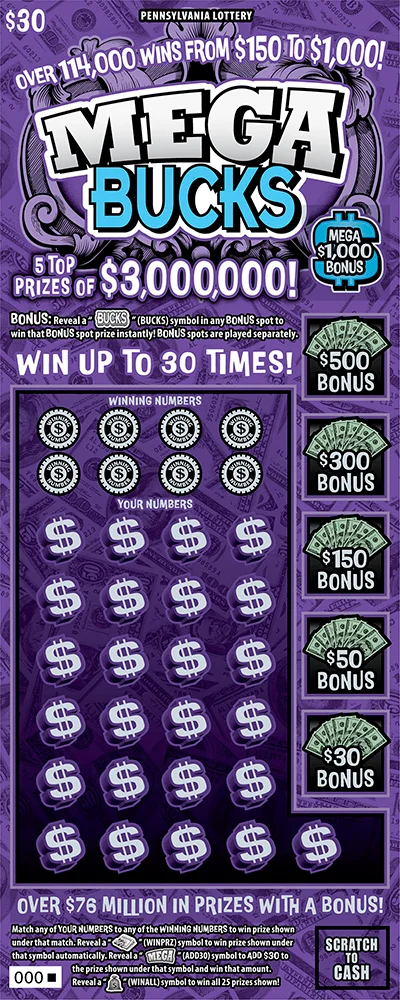 Mega Bucks Mega Bucks | $30 | 77.5% | $3,000,000 |
| 20 | 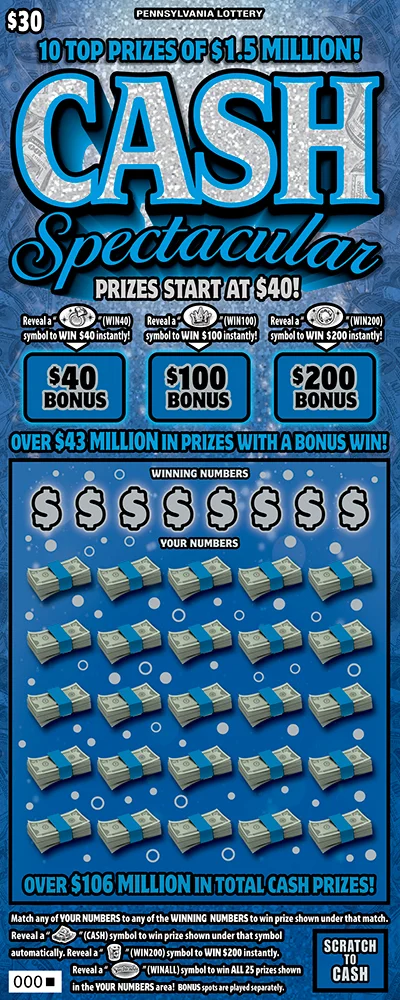 Cash Spectacular Cash Spectacular | $30 | 77.5% | $1,500,000 |
| 21 | 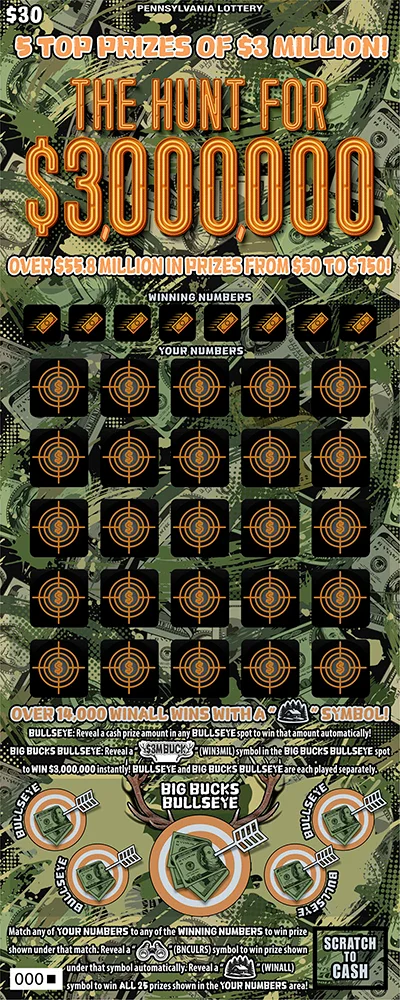 The Hunt for $3,000,000 The Hunt for $3,000,000 | $30 | 77.5% | $3,000,000 |
| 22 | 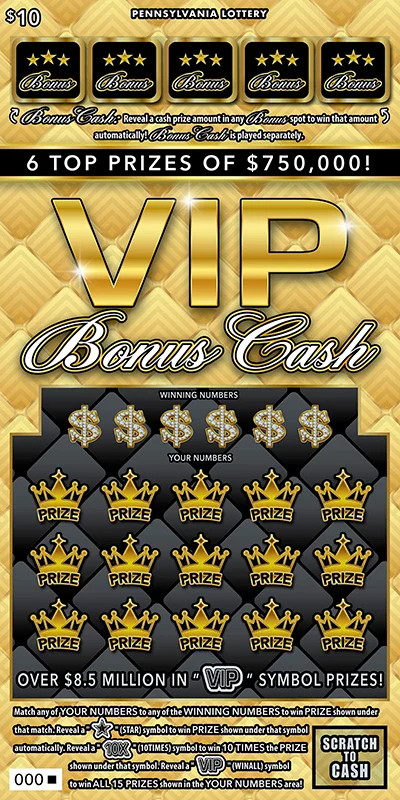 VIP Bonus Cash VIP Bonus Cash | $10 | 76.9% | $750,000 |
| 23 | 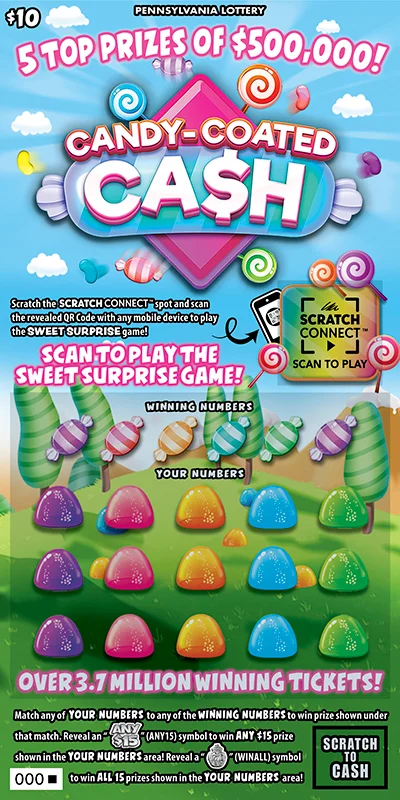 Candy-Coated Ca$h Candy-Coated Ca$h | $10 | 76.9% | $500,000 |
| 24 | 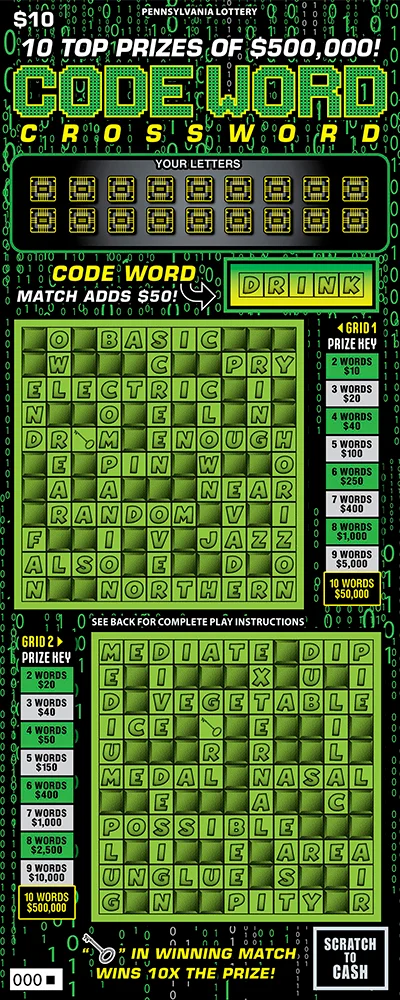 Code Word Crossword Code Word Crossword | $10 | 76.9% | $500,000 |
| 25 | 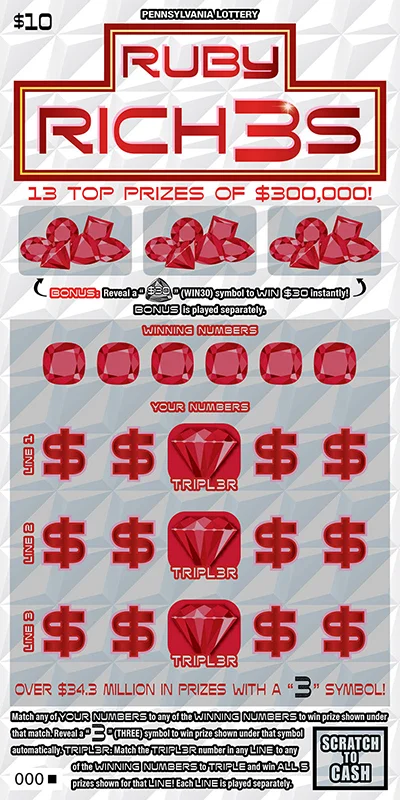 Ruby Rich3s Ruby Rich3s | $10 | 76.8% | $300,000 |
| 26 | 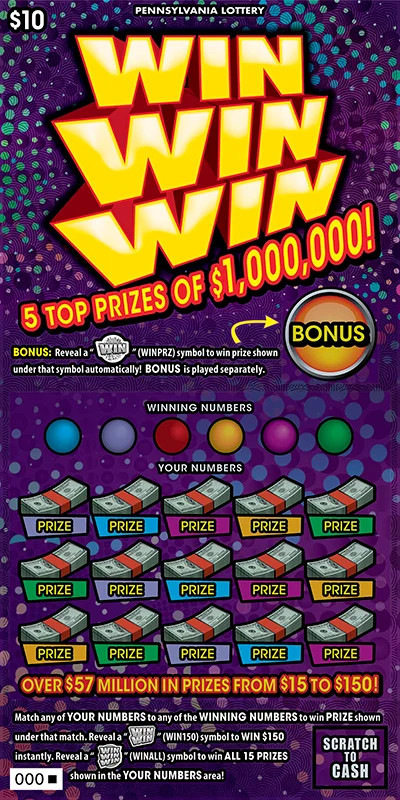 Win Win Win Win Win Win | $10 | 76.8% | $1,000,000 |
| 27 | 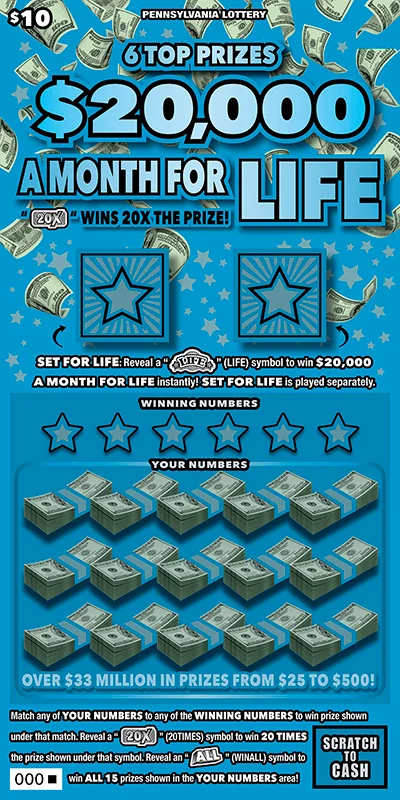 $20,000 a Month for Life $20,000 a Month for Life | $10 | 76.8% | $3,200,000 |
| 28 | 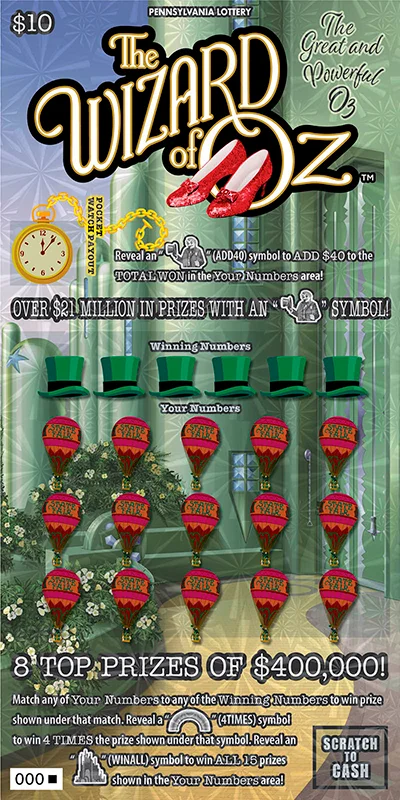 THE WIZARD OF OZ™ THE GREAT AND POWERFUL OZ THE WIZARD OF OZ™ THE GREAT AND POWERFUL OZ | $10 | 76.8% | $400,000 |
| 29 | 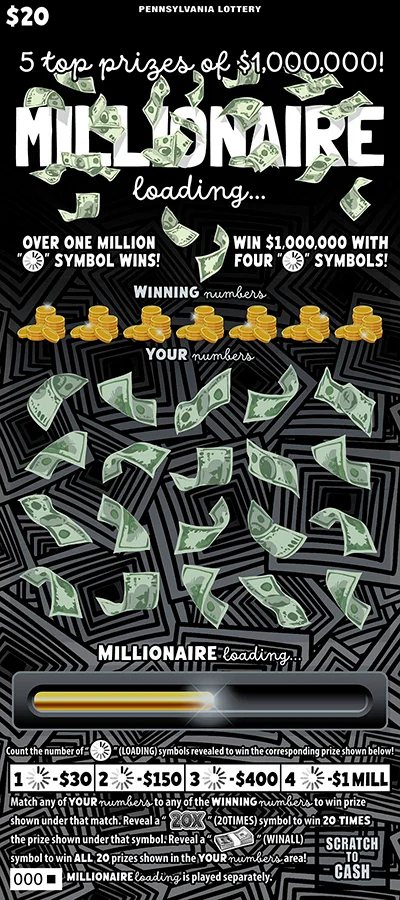 Millionaire Loading Millionaire Loading | $20 | 75.5% | $1,000,000 |
| 30 | 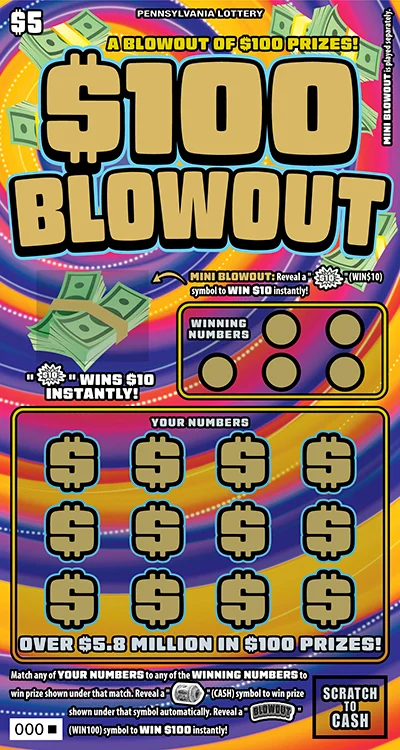 $100 Blowout $100 Blowout | $5 | 75.1% | $100 |
| 31 | 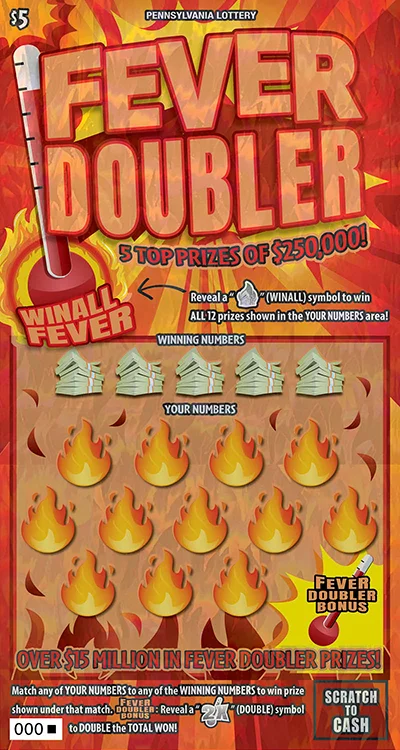 Fever Doubler Fever Doubler | $5 | 74.5% | $250,000 |
| 32 | 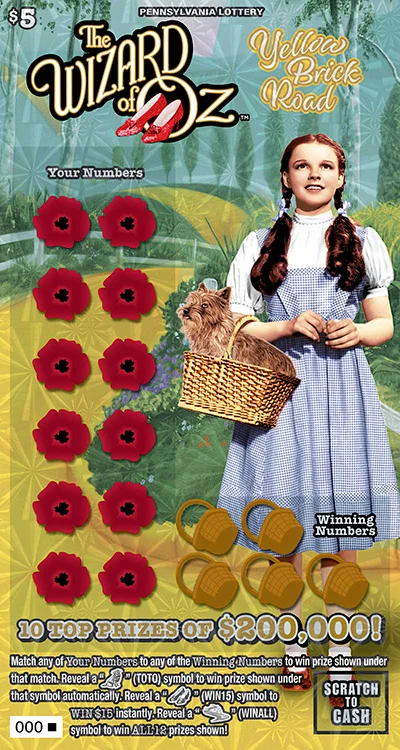 THE WIZARD OF OZ™ YELLOW BRICK ROAD THE WIZARD OF OZ™ YELLOW BRICK ROAD | $5 | 74.5% | $200,000 |
| 33 | 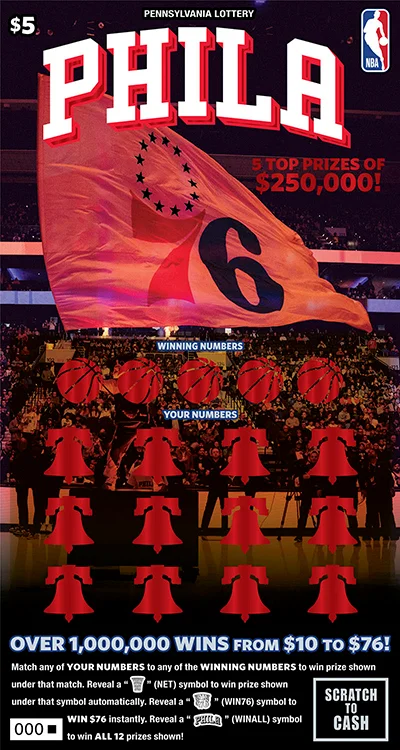 PHILADELPHIA 76ERS PHILADELPHIA 76ERS | $5 | 74.5% | $250,000 |
| 34 | 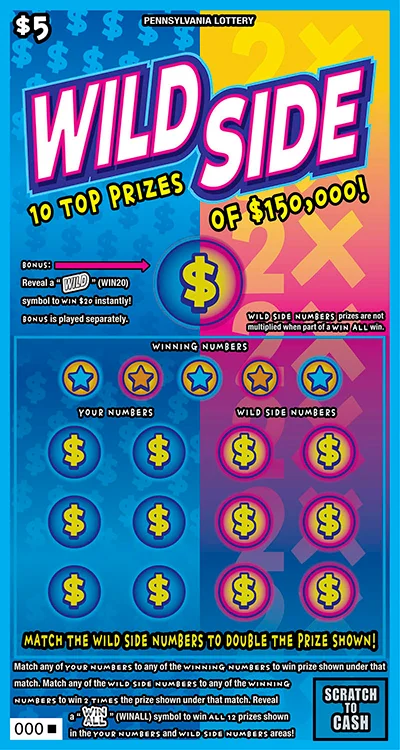 Wild Side Wild Side | $5 | 74.5% | $150,000 |
| 35 | 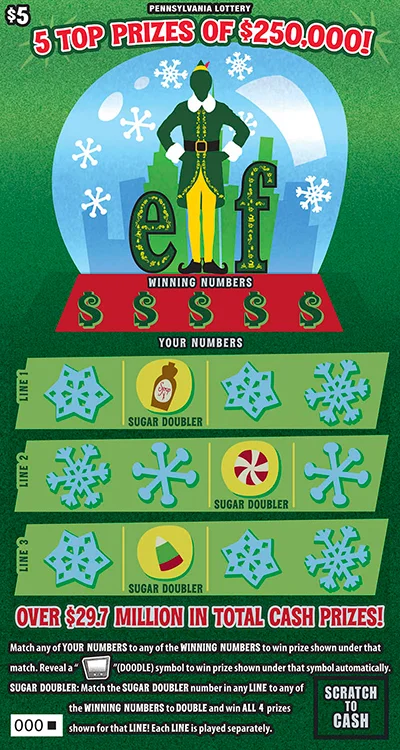 ELF ELF | $5 | 74.5% | $250,000 |
| 36 | 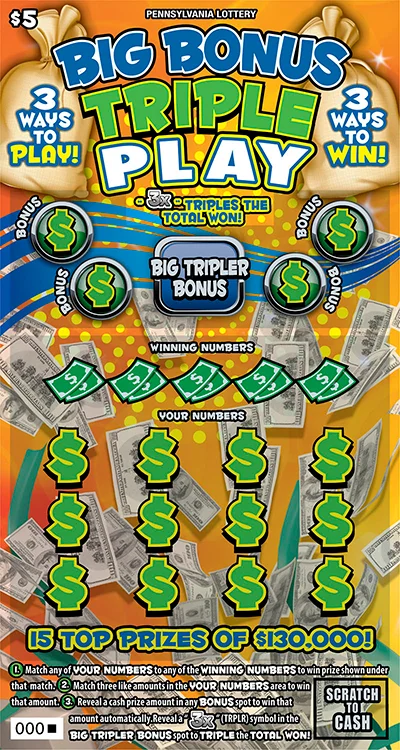 Big Bonus Triple Play Big Bonus Triple Play | $5 | 74.5% | $130,000 |
| 37 | 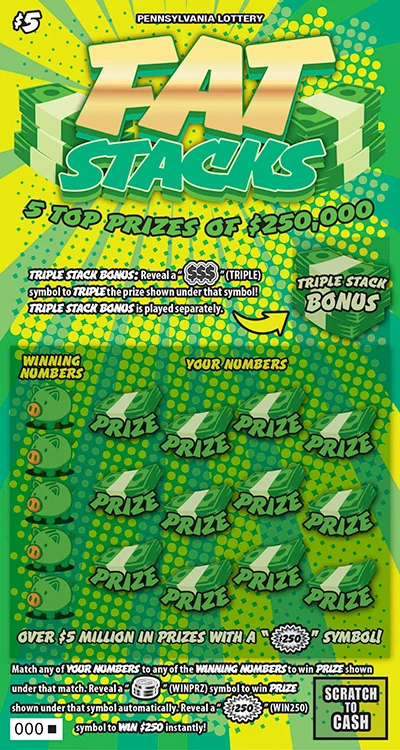 Fat Stacks Fat Stacks | $5 | 74.5% | $250,000 |
| 38 | 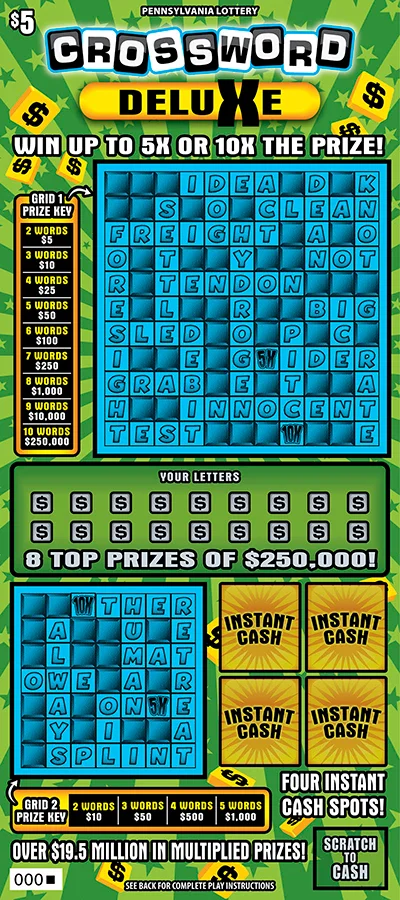 Crossword Deluxe Crossword Deluxe | $5 | 74.5% | $250,000 |
| 39 | 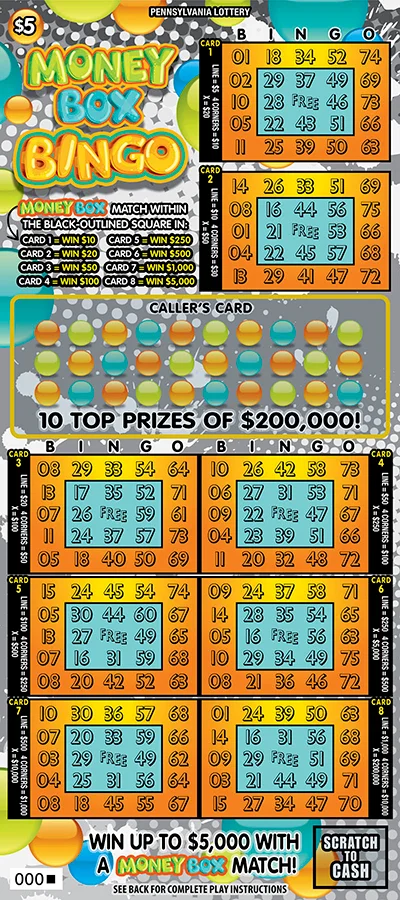 Money Box Bingo Money Box Bingo | $5 | 74.5% | $200,000 |
| 40 | 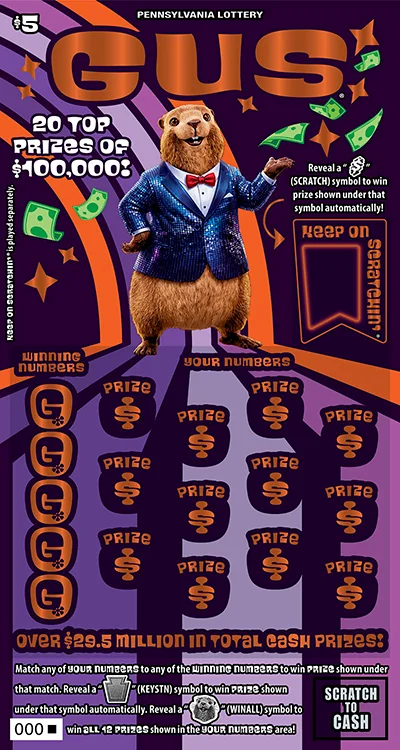 GUS® GUS® | $5 | 74.5% | $100,000 |
| 41 | 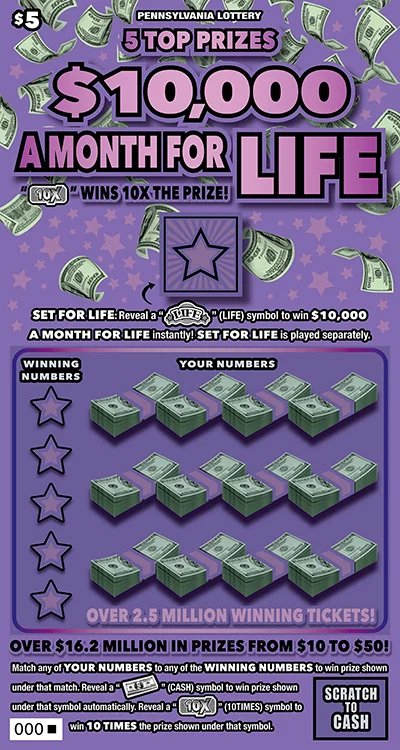 $10,000 a Month for Life $10,000 a Month for Life | $5 | 73.9% | $1,600,000 |
| 42 | 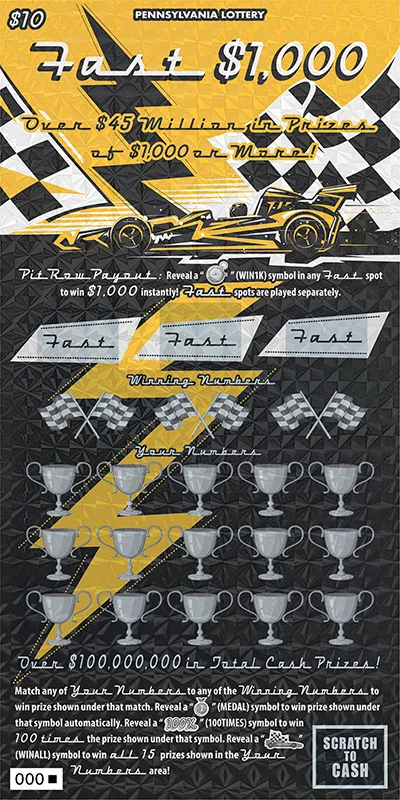 Fast $1,000 Fast $1,000 | $10 | 73.7% | $100,000 |
| 43 | 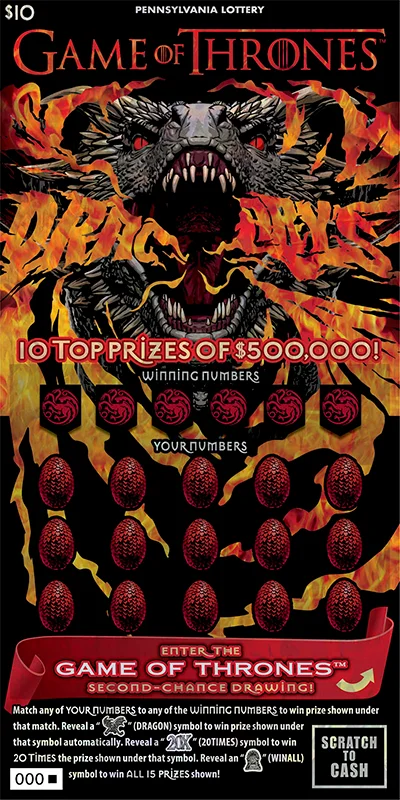 GAME OF THRONES™ GAME OF THRONES™ | $10 | 73.6% | $500,000 |
| 44 |  JURASSIC PARK JURASSIC PARK | $10 | 73.5% | $500,000 |
| 45 | 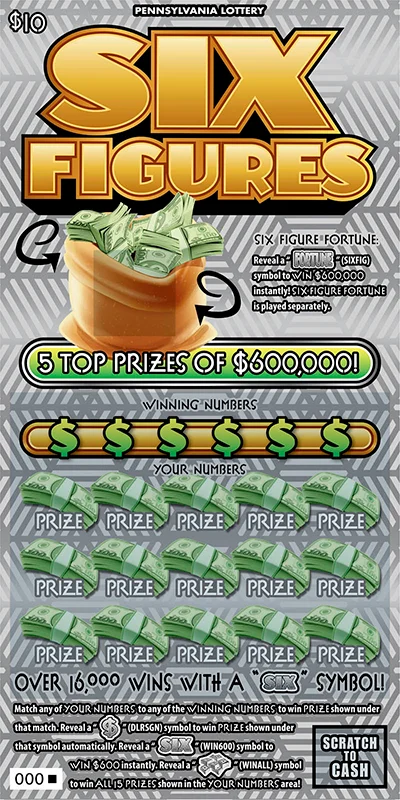 Six Figures Six Figures | $10 | 73.5% | $600,000 |
| 46 | 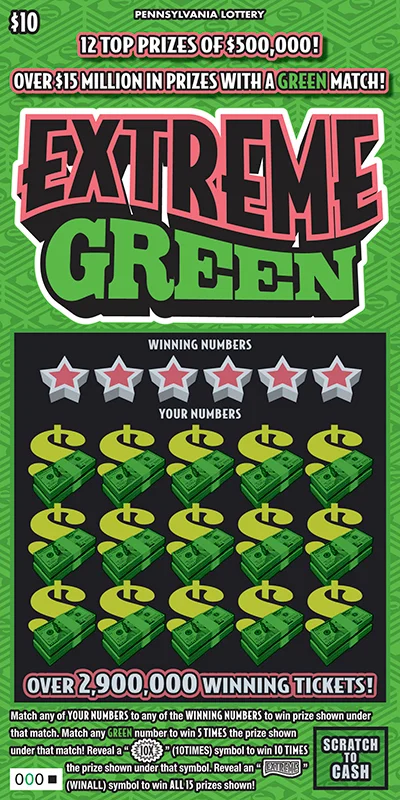 Extreme Green Extreme Green | $10 | 73.5% | $500,000 |
| 47 | 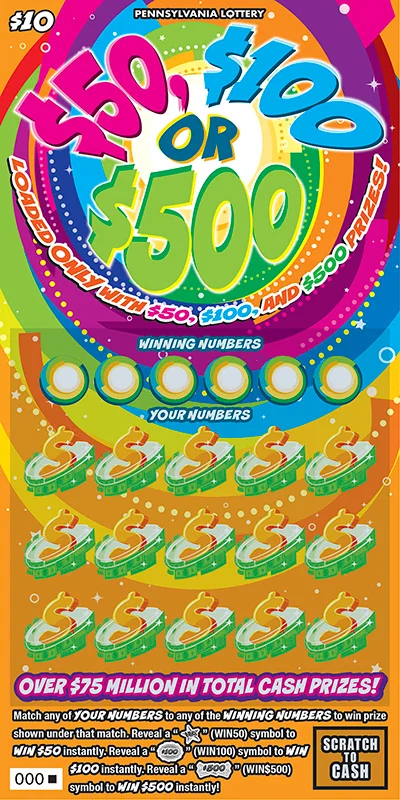 $50, $100 or $500 $50, $100 or $500 | $10 | 73.5% | $500 |
| 48 | 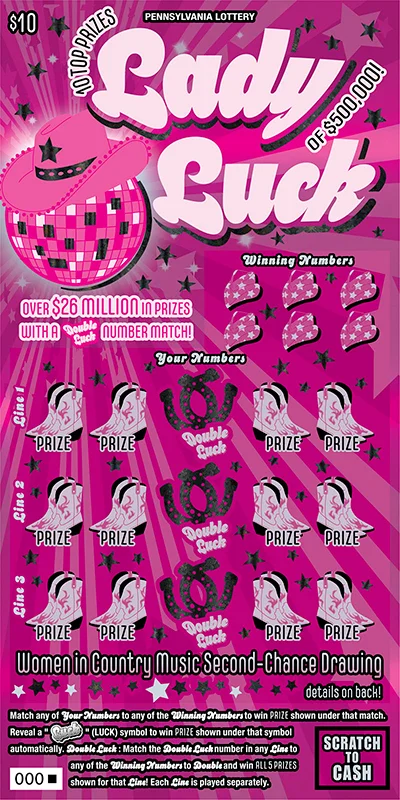 Lady Luck Lady Luck | $10 | 73.5% | $500,000 |
| 49 | 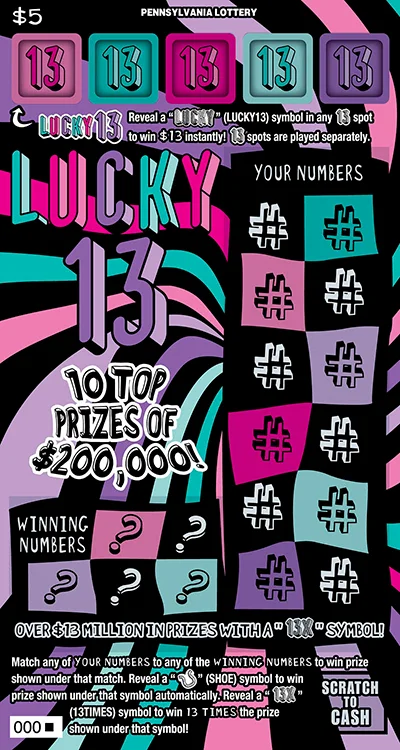 Lucky 13 Lucky 13 | $5 | 71.6% | $200,000 |
| 50 | 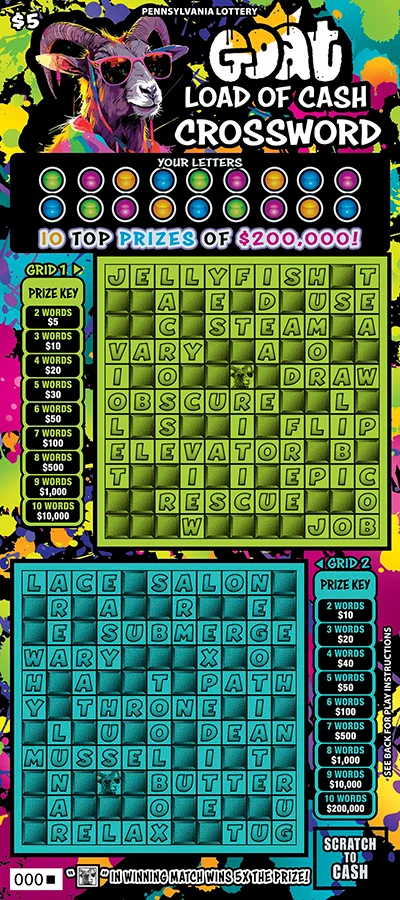 Goat Load of Cash Crossword Goat Load of Cash Crossword | $5 | 71.5% | $200,000 |
| 51 | 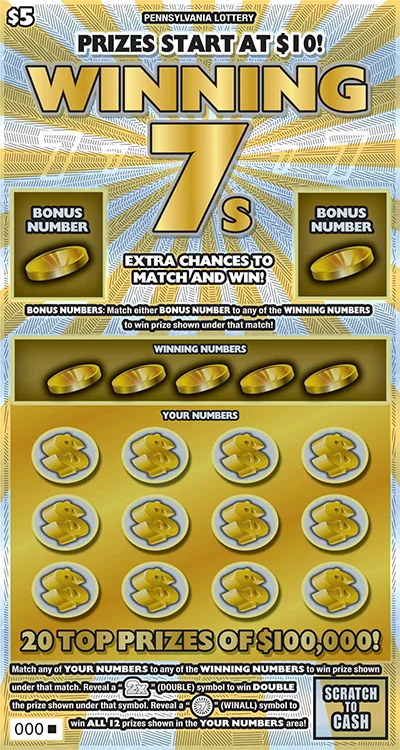 Winning 7s Winning 7s | $5 | 71.5% | $100,000 |
| 52 | 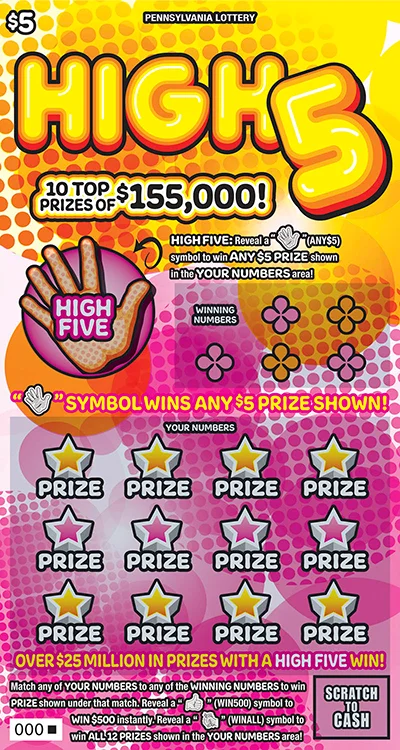 High 5 High 5 | $5 | 71.5% | $155,000 |
| 53 | 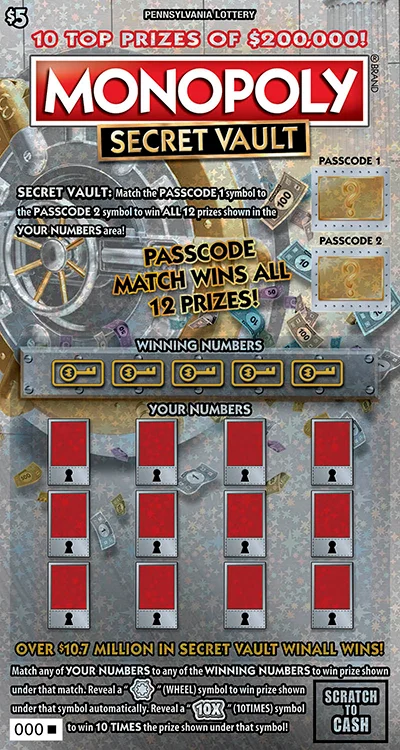 MONOPOLY SECRET VAULT MONOPOLY SECRET VAULT | $5 | 71.3% | $200,000 |
| 54 | 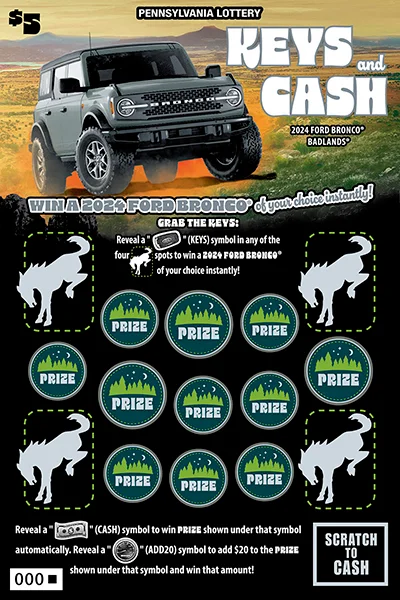 Keys and Cash Keys and Cash | $5 | 71.3% | $100,000 |
| 55 | 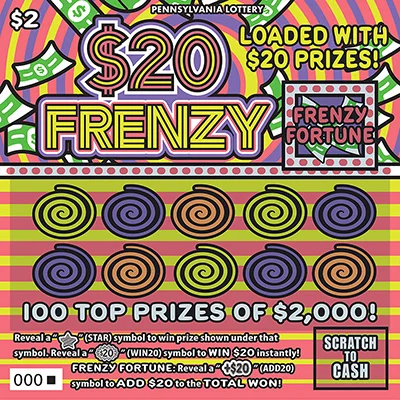 $20 Frenzy $20 Frenzy | $2 | 70.5% | $2,000 |
| 56 | 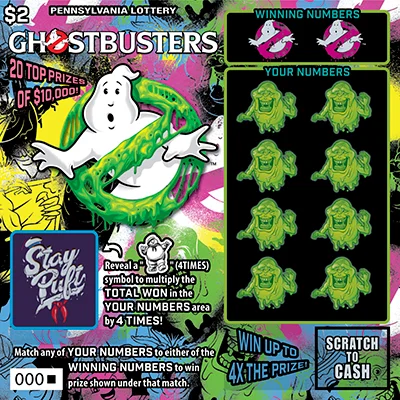 Ghostbusters™ Ghostbusters™ | $2 | 70.5% | $10,000 |
| 57 | 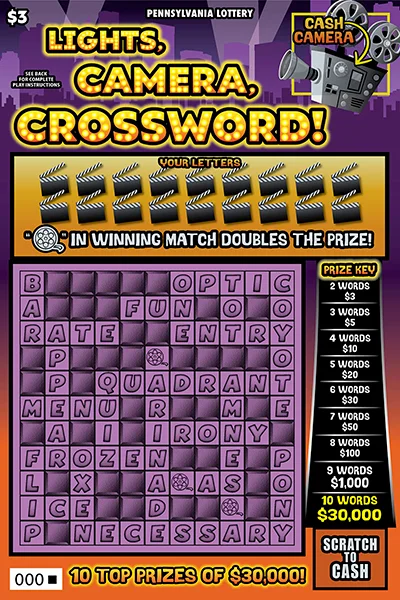 Lights, Camera, Crossword Lights, Camera, Crossword | $3 | 70.5% | $30,000 |
| 58 | 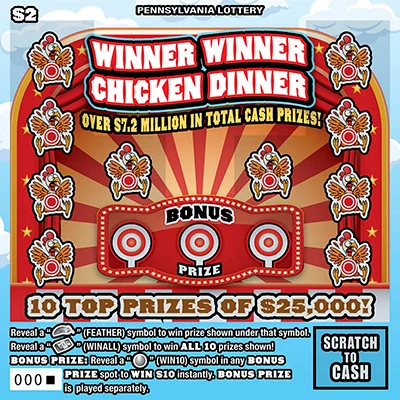 Winner Winner Chicken Dinner Winner Winner Chicken Dinner | $2 | 70.5% | $25,000 |
| 59 | 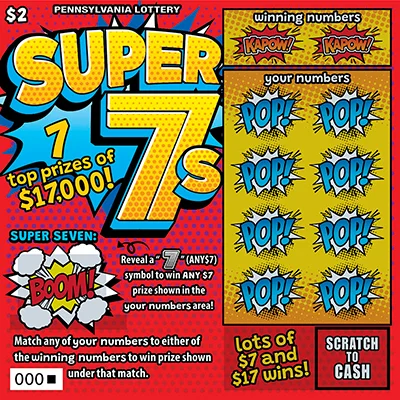 Super 7s Super 7s | $2 | 70.5% | $17,000 |
| 60 | 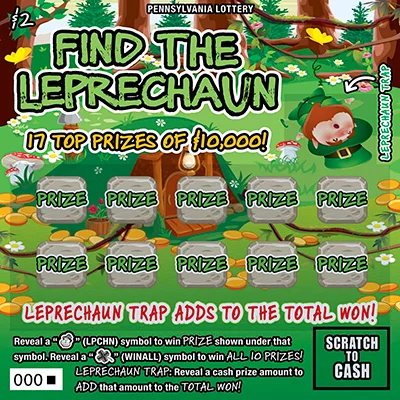 Find the Leprechaun Find the Leprechaun | $2 | 70.4% | $10,000 |
| 61 | 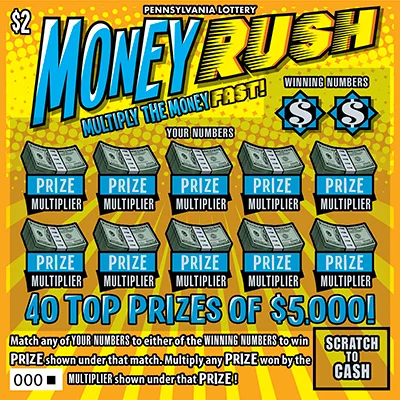 Money Rush Money Rush | $2 | 70.4% | $5,000 |
| 62 | 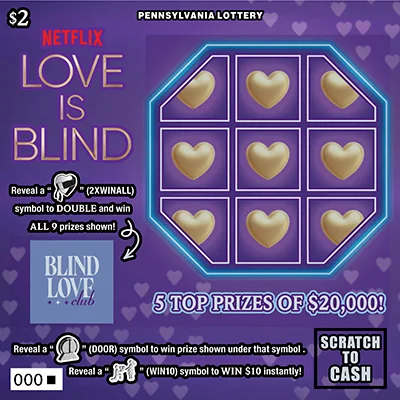 LOVE IS BLIND LOVE IS BLIND | $2 | 68.3% | $20,000 |
| 63 | 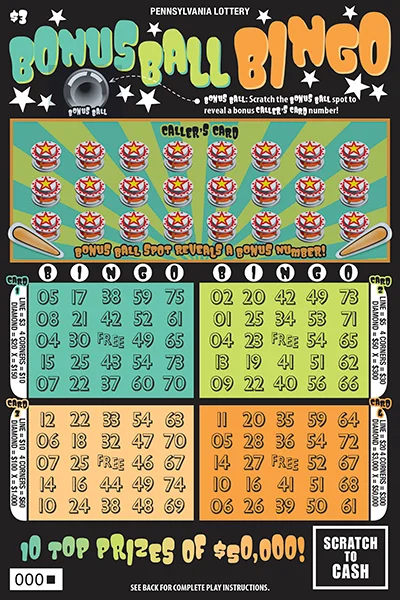 Bonus Ball Bingo Bonus Ball Bingo | $3 | 66.3% | $50,000 |
| 64 | 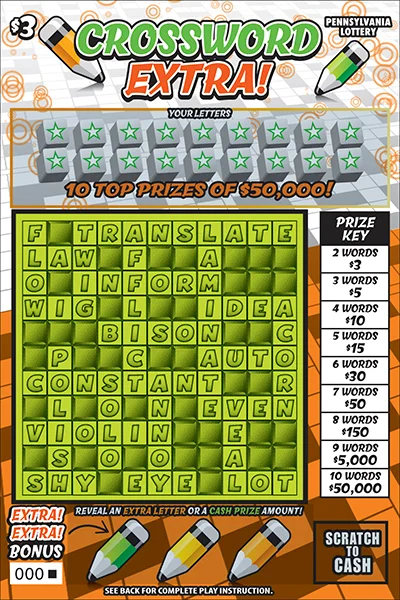 Crossword Extra Crossword Extra | $3 | 66.3% | $50,000 |
| 65 | 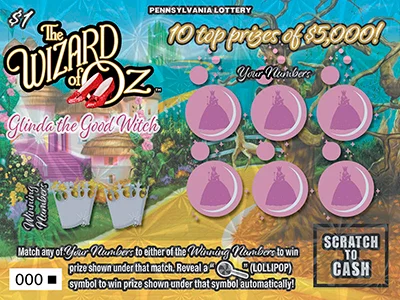 THE WIZARD OF OZ™ GLINDA THE GOOD WITCH THE WIZARD OF OZ™ GLINDA THE GOOD WITCH | $1 | 65.6% | $5,000 |
| 66 | 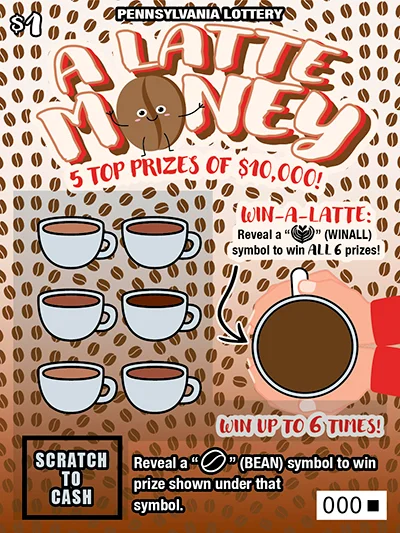 A Latte Money A Latte Money | $1 | 65.6% | $10,000 |
| 67 | 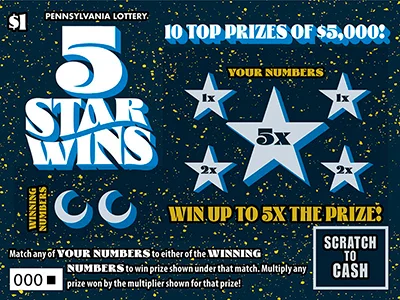 5 Star Wins 5 Star Wins | $1 | 65.6% | $5,000 |
| 68 | 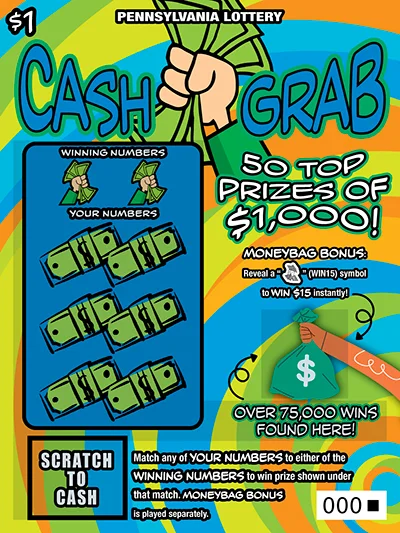 Cash Grab Cash Grab | $1 | 65.6% | $1,000 |
| 69 | 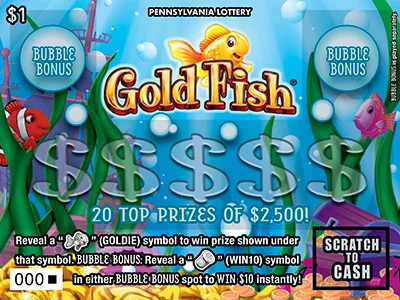 GOLD FISH® GOLD FISH® | $1 | 65.6% | $2,500 |
| 70 | 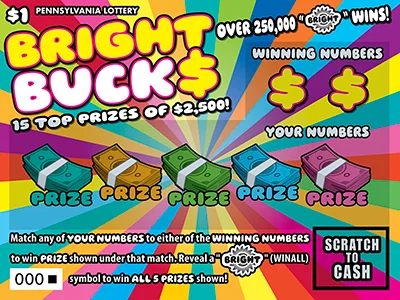 Bright Buck$ Bright Buck$ | $1 | 65.6% | $2,500 |
| 71 | 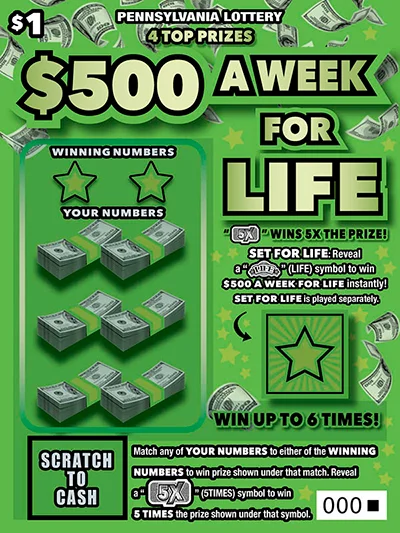 $500 a Week for Life $500 a Week for Life | $1 | 65.0% | $350,000 |
Frequently Asked Questions
What does the Highest Prize Payout ranking measure?
Prize Payout is the share of every ticket-sale dollar the state returns as prizes, across all tiers. A higher payout percentage means more of the money goes back to players. State lotteries typically keep 25 to 40%; payouts above 70% are unusually generous.
Which Pennsylvania scratch-off is currently #1 for highest prize payout?
The Merry Money Match ($30) currently ranks first with overall odds of 1 in 2.79 (ValueScore 78 of 100). Prize payout is 82.5%. Rankings update automatically as prize counts change, so the top pick can move. Open the game page for the full prize-tier breakdown and remaining counts.
How often does this ranking update?
Game data for Pennsylvania is refreshed from official sources on a daily schedule. Whenever remaining-prize counts change, ValueScore and every dependent ranking are recomputed automatically. The "updated daily" stamp on the page reflects the most recent successful update.
How should I pick between the top few games in Pennsylvania?
Rankings are a starting point, not a verdict. Two tickets that sit next to each other often differ on a dimension the headline metric ignores: price, top-prize size, or remaining inventory. Use the Budget & Goal Optimizer or the side-by-side Compare tool to weigh Breakeven probability, Jackpot Chase value, or published EV against your actual spend and goal.
Are these values official or estimated?
ScratchCheck uses official published odds and prize counts wherever the state makes them available. A small number of states publish only limited prize breakdowns; for those games ScratchCheck estimates Expected Value and related metrics from industry price-point averages and flags them with an "~Est." tag next to the number. Official figures always take precedence.