
New Jersey · Best $1 Million+ Odds
Last updated October 19, 2026
Best shot at winning $1 million+ in New Jersey: $1,000,000 Payday ($30) at 1 in 1,029,857.78. Ranked by the best odds of hitting a million-dollar or higher prize.
| Rank | Game | Price | Prize | Odds | Remaining |
|---|---|---|---|---|---|
| 1 | 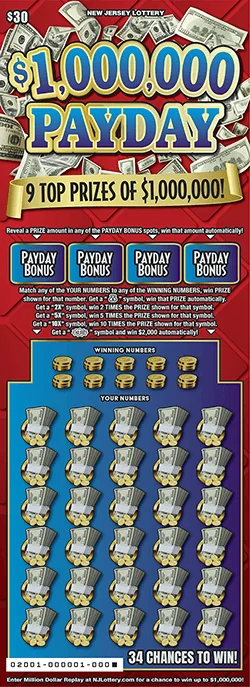 $1,000,000 Payday $1,000,000 Payday | $30 | $1M | 1 in 1,029,857.78 | 9 |
| 2 | 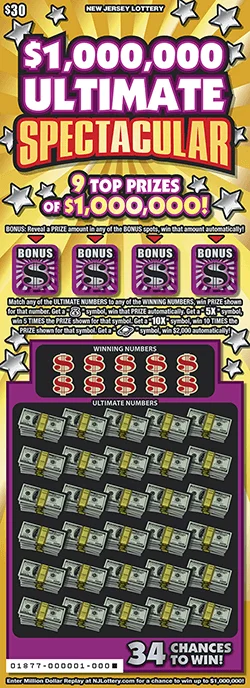 $1,000,000 Ultimate Spectacul $1,000,000 Ultimate Spectacul | $30 | $1M | 1 in 1,042,077.78 | 4 |
| 3 | 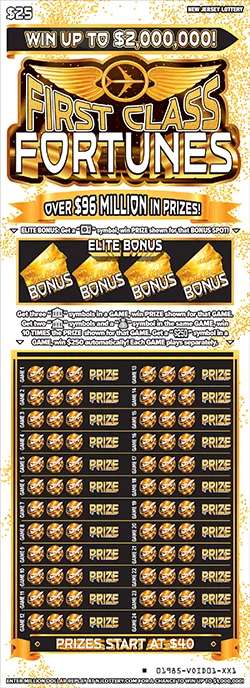 First Class Fortunes First Class Fortunes | $25 | $2M | 1 in 1,851,640 | 3 |
| 4 | 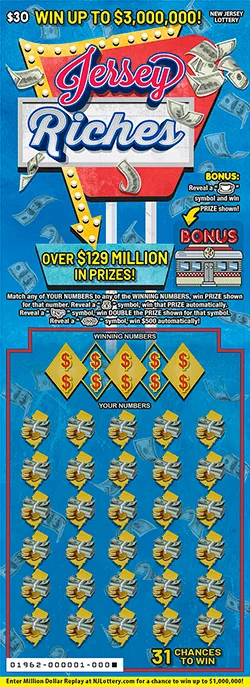 Jersey Riches Jersey Riches | $30 | $3M | 1 in 2,195,346.67 | 2 |
| 5 | 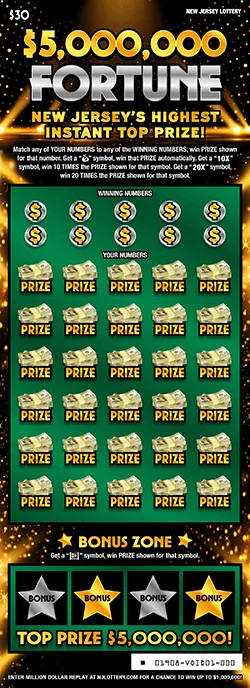 $5,000,000 Fortune $5,000,000 Fortune | $30 | $5M | 1 in 2,343,486.67 | 1 |
| 6 | 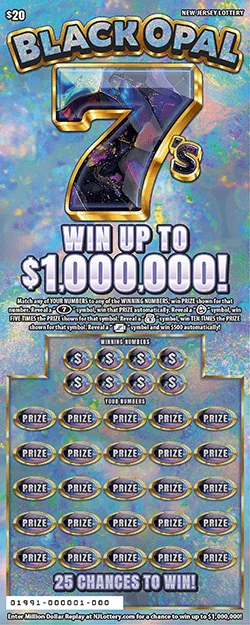 Black Opal 7's Black Opal 7's | $20 | $1M | 1 in 2,432,740 | 2 |
| 7 | 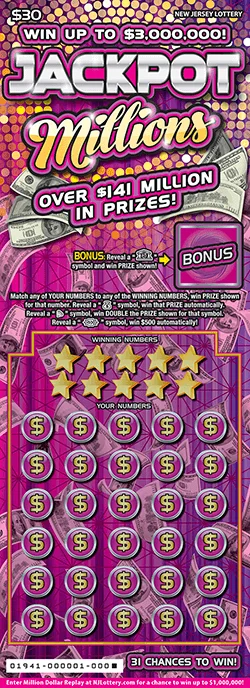 Jackpot Millions Jackpot Millions | $30 | $3M | 1 in 2,433,193.33 | 2 |
| 8 | 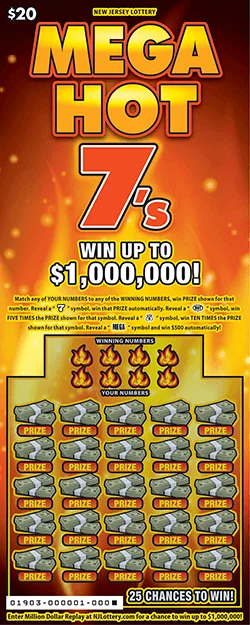 Mega Hot 7's Mega Hot 7's | $20 | $1M | 1 in 2,439,133.33 | 1 |
| 9 | 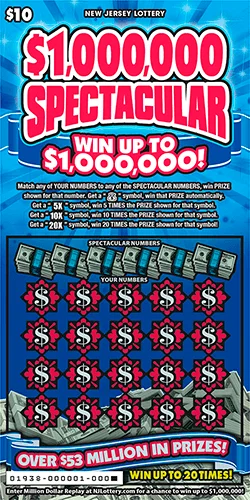 $1,000,000 Spectacular $1,000,000 Spectacular | $10 | $1M | 1 in 2,440,627.5 | 1 |
| 10 | 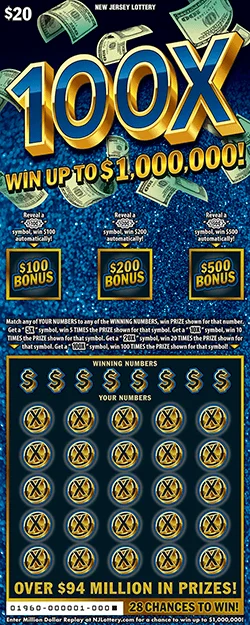 100X 100X | $20 | $1M | 1 in 2,458,086.67 | 1 |
| 11 | 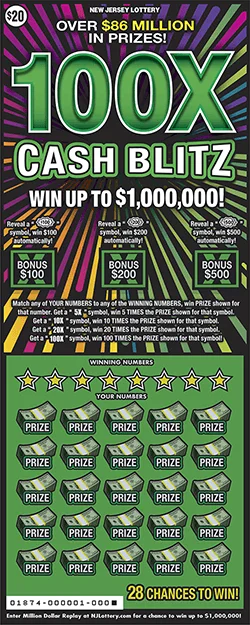 100X Cash Blitz 100X Cash Blitz | $20 | $1M | 1 in 2,458,660 | 1 |
| 12 | 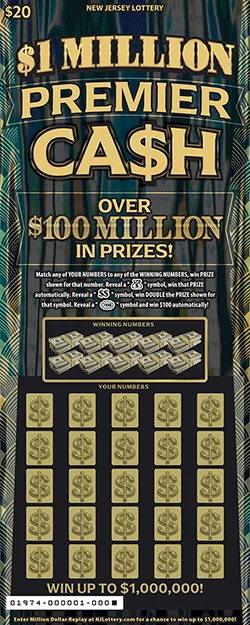 $1 Million Premier Ca$h $1 Million Premier Ca$h | $20 | $1M | 1 in 2,635,433.33 | 3 |
| 13 | 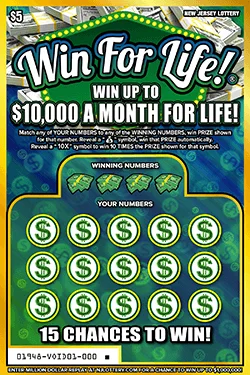 Win For Life! Win For Life! | $5 | $1.8M | 1 in 4,325,800 | 1 |
Frequently Asked Questions
What does the Best $1 Million+ Odds ranking measure?
This page ranks games by the odds of winning the specific prize tier named in the page title. Only games that offer that prize level are included. Lower "1 in N" is better.
Which New Jersey scratch-off is currently #1 for best $1 million+ odds?
The $1,000,000 Payday ($30) currently ranks first with overall odds of 1 in 3.64 (ValueScore 96 of 100). Prize payout is 77.2%. Rankings update automatically as prize counts change, so the top pick can move. Open the game page for the full prize-tier breakdown and remaining counts.
How often does this ranking update?
Game data for New Jersey is refreshed from official sources on a daily schedule. Whenever remaining-prize counts change, ValueScore and every dependent ranking are recomputed automatically. The "updated daily" stamp on the page reflects the most recent successful update.
How should I pick between the top few games in New Jersey?
Rankings are a starting point, not a verdict. Two tickets that sit next to each other often differ on a dimension the headline metric ignores: price, top-prize size, or remaining inventory. Use the Budget & Goal Optimizer or the side-by-side Compare tool to weigh Breakeven probability, Jackpot Chase value, or published EV against your actual spend and goal.
Are these values official or estimated?
ScratchCheck uses official published odds and prize counts wherever the state makes them available. A small number of states publish only limited prize breakdowns; for those games ScratchCheck estimates Expected Value and related metrics from industry price-point averages and flags them with an "~Est." tag next to the number. Official figures always take precedence.